A box-and-whisker plot summarizes a distribution compactly. Its rectangle spans the first quartile to the third quartile, a line marks the median, and whiskers extend toward the minimum and maximum values. Outliers may appear as dots beyond the whiskers. section 6.4
Build a box plot in D3 by following this sequence:
- Find the dataset’s minimum and maximum values. section 6.4
- Use d3.scaleQuantile() to calculate the first quartile, median, and third quartile. section 6.4 section 6.6
- Map values through a vertical scale, then append SVG rectangles and lines using the resulting positions. section 6.4 section 6.4.4
- Set the rectangle height from the third-quartile position to the first-quartile position, accounting for the SVG y-axis direction. section 6.4.4
Comparing salary distributions
Place two box plots on one chart to compare salaries for women and men working in data visualization in the United States. Use a discrete horizontal scale for the categories and a continuous vertical scale for salaries. The vertical scale positions each minimum, quartile, median, and maximum; individual salary points can be overlaid as circles, with randomized horizontal positions to reduce overlap. section 6.4.2 section 6.4.4
Figure 6.14 A box plot is composed of a rectangle extending from the first to the third quartile, a line positioned at the median, and whiskers extending from the minimum value to the first quartile and from the third quartile to the maximum value.
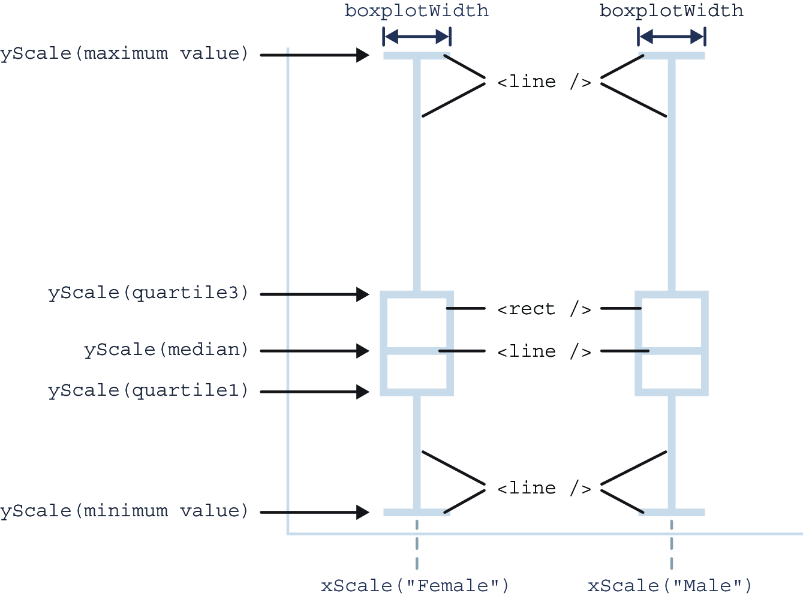
Use the annotated figure to identify the rectangle, median line, and two whisker segments that form the complete plot. section 6.4.4





