A continuous function changes smoothly: sufficiently small changes in its input produce sufficiently small changes in its output. In a variational autoencoder (VAE), continuity makes nearby latent points decode into similar images. section 17.1.2
Continuity gives a VAE latent space two practical properties:
- Nearby points represent related outputs rather than isolated examples. section 17.1.2
- Together with low dimensionality, it makes latent directions meaningful and supports manipulation through concept vectors. section 17.1.2
Sampling a continuous latent neighborhood
The encoder maps an input image to z_mean and z_log_var. A random sample z = z_mean + exp(0.5 * z_log_var) * epsilon is decoded back into an image. Because sampling varies around z_mean, nearby latent points can produce images similar to the input. section 17.1.2
Figure 17.4 A VAE maps an image to two vectors, z_mean and z_log_var, which define a probability distribution over the latent space, used to sample a latent point to decode.
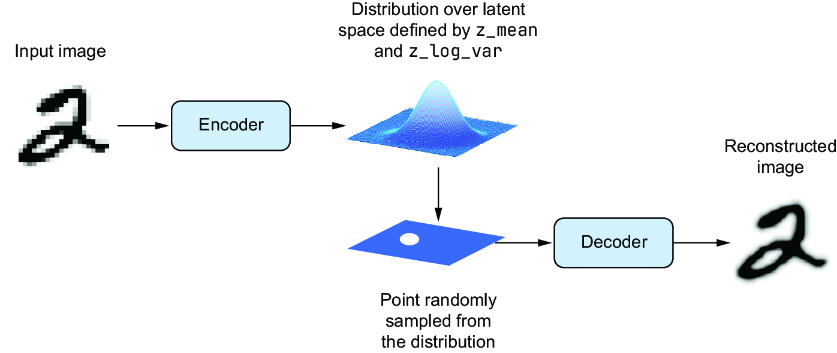
Use the diagram to trace how an image becomes a probability distribution over latent points before decoding. section 17.1.2