Continuous data describes values that can be divided into smaller units while remaining meaningful. Temperature illustrates the idea: 17°C can become 16.8°C or a still more precise measurement. Continuous values may occur anywhere within a defined interval, unlike discrete values, which belong to a predetermined set. section 3.1.2 section 3.4.1
Use continuous data to guide visualization and scale choices:
- Treat measured quantities such as time, weight, temperature, salaries, and GDP as quantitative data that may be continuous. section 3.1.2 section 6.4.2
- Prefer visual channels such as position, length, area, angle, or a continuous color scale for quantitative values. section 14.2
- Map a continuous domain with a suitable scale: a linear scale can transform data values into a continuous pixel range. section 3.4.1
- Use a sequential color scale when a continuous quantity should become a graded color range, as in a choropleth map. section 13.2.3
Mapping values to chart positions
A D3 linear scale can map values from 0 through 200 to positions from 0 through 20: d3.scaleLinear().domain([0, 200]).range([0, 20]). Calling the resulting scale with 100 returns 10. The same pattern positions salaries along the continuous vertical axis of a box plot. section 3.4.1 section 6.4.2
Figure 3.4 A classification of data types
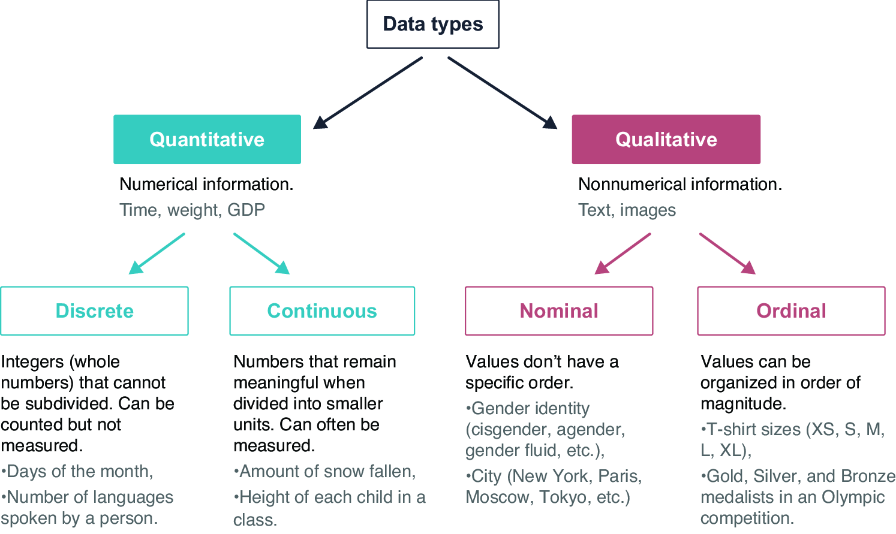
A classification diagram places continuous data within the quantitative category, alongside discrete data, and distinguishes both from qualitative data. section 3.1.2




