Continuous data can take any value along a spectrum or interval, including values between whole numbers. A fruit’s taste score might be 7, 7.5, or 7.83 rather than only an integer. Whether something counts as continuous can depend on the scale: hourly data may be effectively continuous when viewed across months, while daily data may appear continuous across centuries. section 3.4.1
Continuity helps determine how a visualization should connect marks. Line charts work well for continuous dimensions because connected forms suggest an unbroken progression. Bar charts usually suit discrete dimensions, where separate categories should remain visibly separate. These are useful defaults, not iron laws: the audience should still be able to read the intended story. section 3.4.1 section 3.6
Use continuity as a quick visualization check:
- Ask whether values can occur between the recorded values, rather than assuming every number is continuous. section 3.4.1
- Treat dates, times, and datetimes according to the scale and level of detail being shown. section 3.4.1
- Use lines for continuous change and bars for separate categories unless another design makes the relationship clearer. section 3.4.1 section 3.6
Fruit data
Fruit ID numbers are discrete, but taste scores can be continuous because they may include decimals. A line connecting different fruits implies a progression that does not exist; a bar chart keeps the fruits separate. Plotting taste scores over time, however, could make a line chart meaningful—for example, when showing peak seasonal taste. section 3.4.1
Figure 3.1 The fruit data shown as a line on the left just doesn’t work because the fruits aren’t continuous, nor could one approximate them as such. On the right, the viz works much better as a bar chart.
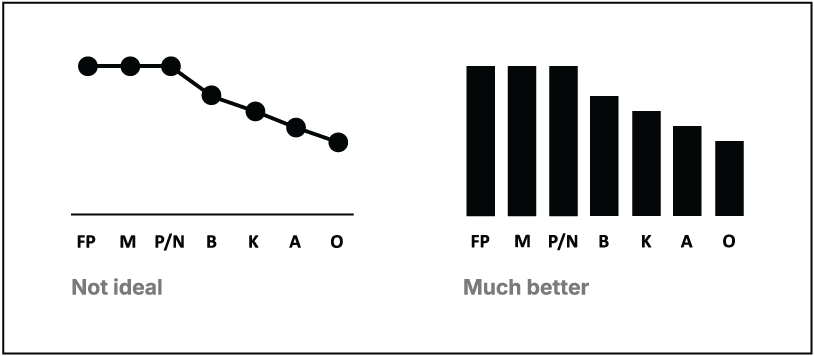
Compare the misleading line chart with the more suitable bar chart for fruit categories. section 3.4.1




