The cyclically adjusted price-to-earnings ratio, or CAPE, divides a stock or index’s current price by its average real, inflation-adjusted earnings over the preceding ten years. The long averaging period reduces noise from short-term economic and market disruptions. section 7.6.2
Use CAPE as a long-term valuation signal, not a timing guarantee:
- High readings can indicate overvaluation and support reducing equity exposure in favor of bonds, gold, or alternatives. section 7.6.2
- Low readings can indicate undervaluation and support increasing equity exposure, while still requiring caution. section 7.6.2
- Interpret historical comparisons carefully because interest rates, tax laws, and index composition can change the appropriate valuation range. section 7.6.2
S&P 500 reference points
An historical average near 16–18 provides context: readings above 30 may suggest an overheated market, while readings below 10 may suggest buying opportunities. Neither level predicts an imminent crash or immediate gains. section 7.6.2
Figure 7.10 Shiller CAPE ratio per month
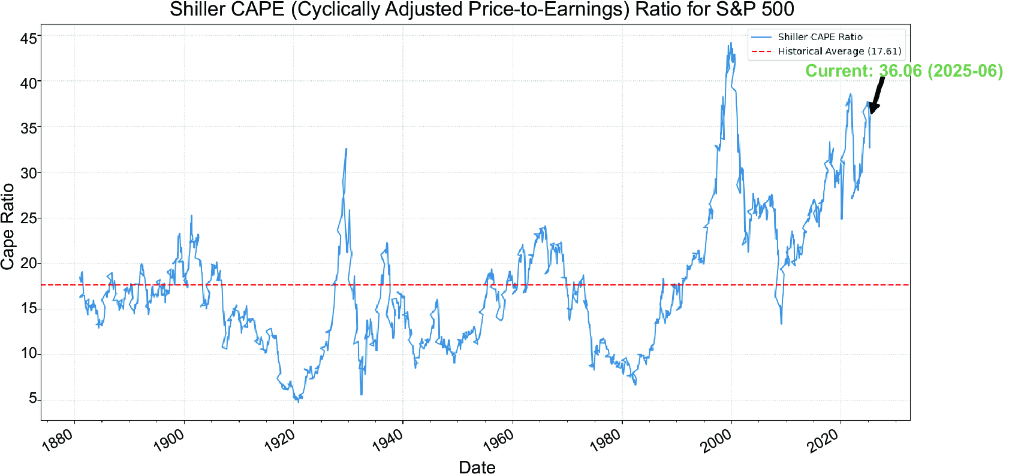
Inspect monthly CAPE values to place current market valuation in historical context. section 7.6.2

