Data storytelling turns data analysis into a narrative that helps an audience understand an insight, its context, and what to do next. Rather than treating a chart as the final product, it treats presentation as the audience-facing finale of the data science flow. The aim is not merely to display results, but to engage people and support decisions. section 1.1 section 1.1.1
Start from the audience’s perspective. Ask what message matters, what background they need, and which next step they should consider. This shift helps reports, presentations, and dashboards avoid overwhelming people with raw numbers, charts, or cluttered interfaces. section 1.1 section 1.1.2
Build a data story progressively with the DIKW pyramid:
- Extract meaningful information from raw data rather than presenting all available values. section 1.4
- Add context that explains the background and turns information into knowledge. section 1.4 section 5.2.1
- Add a call to action or next steps, turning understood knowledge into wisdom. section 1.4.3 section 5.2.1
From a pet-event chart to a recommendation
A pet-event dataset first shows participation counts: one dog for every ten pets and the rest cats. Context identifies weak advertising for dogs as a reason dog owners were less interested. A call to action then recommends increasing advertising on dog-related websites. The story moves from data, to insight, to explanation, to action. section 1.4.3
A useful narrative shape begins with background and a hook, reveals the central insight, gives the audience time to reflect, and ends with proposed next steps. In practice, identify the main point first, set the background that makes it meaningful, then decide the action you want the audience to consider. section 5.2 section 5.2.1
Figure 5.10 A mapping of the data storytelling arc and the DIKW pyramid
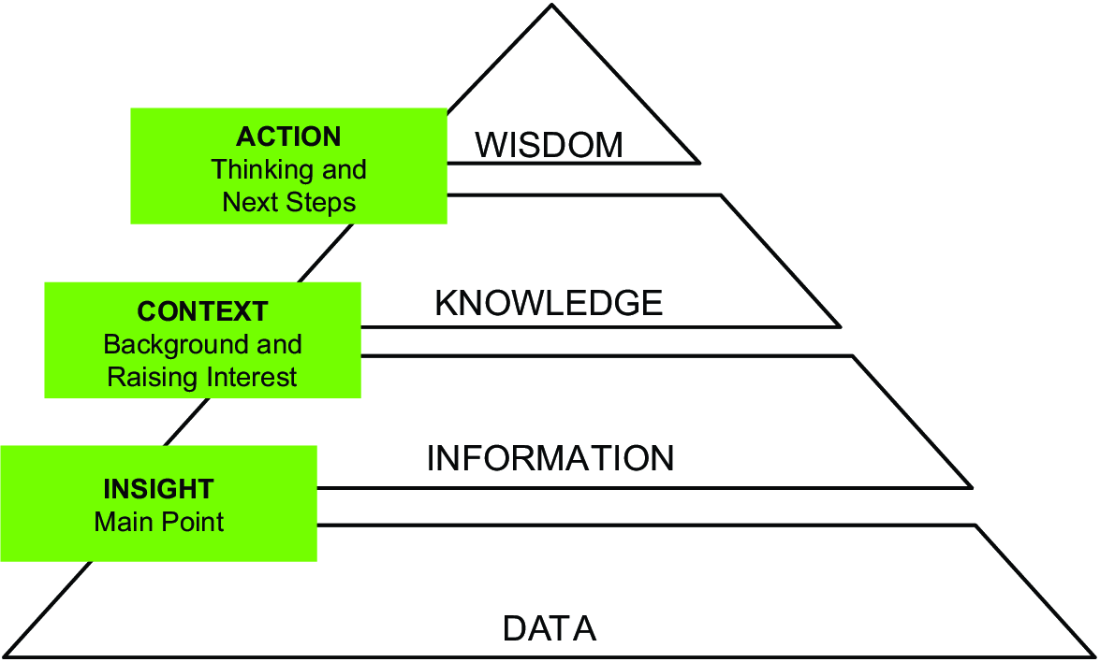
Compare the storytelling arc with DIKW to see how insight, context, and action map onto a narrative structure. section 5.2.1
A chart alone can communicate an exploratory finding without making a persuasive case. To become explanatory, it needs background, a clear main point, and next steps that address the audience’s question. This distinction matters when a proposal depends on audience support or a decision. section 5.1.2
Python Altair can support chart construction, while generative AI tools can assist the presentation phase by saving time, generating code frameworks, and helping produce engaging text or context. Treat generated output as assistance: break requests into small steps and manually improve the result. These tools are not positioned for big-data analytics or complex reports that summarize big data. section 1.2.2 section 2.5 section 1.5
Data storytelling takes time and teamwork. It also carries a responsibility to seek truth behind the data and handle it carefully, recognizing that data can represent people. Once complete, a story can be shared through dashboards, embedded tools, or a standalone web application. section 1.1.3 section 11.7 section 11.8

