Diminishing returns occur when each additional increase in an input produces a smaller incremental improvement in an outcome. More input may still help, but the next increment is less valuable than the previous one—and it can sometimes make a result worse. section 6.4.1
For model development, repeated passes over the same corpus still help, but their gains diminish. More compute and scraped data are not a reliable substitute for improvements in data curation, post-training, reasoning, tool use, architecture, or method. The engineering question becomes what to build around the model available now, rather than assuming that scale alone will fix its limitations. section 1.2
More query history
In a query benchmark, moderate-query accuracy rose from about 0.39 with no prior queries to 0.56 with 10, then only to 0.61 with 20. Challenging queries showed a slight p90 regression at 20 examples. Ten prior queries was a sweet spot in this benchmark, not a universal setting: compare accuracy across difficulty levels and percentiles, and include model-running cost in the decision. section 6.4.1
Figure 6.1 Comparison of the p50 vs the number of last queries submitted.
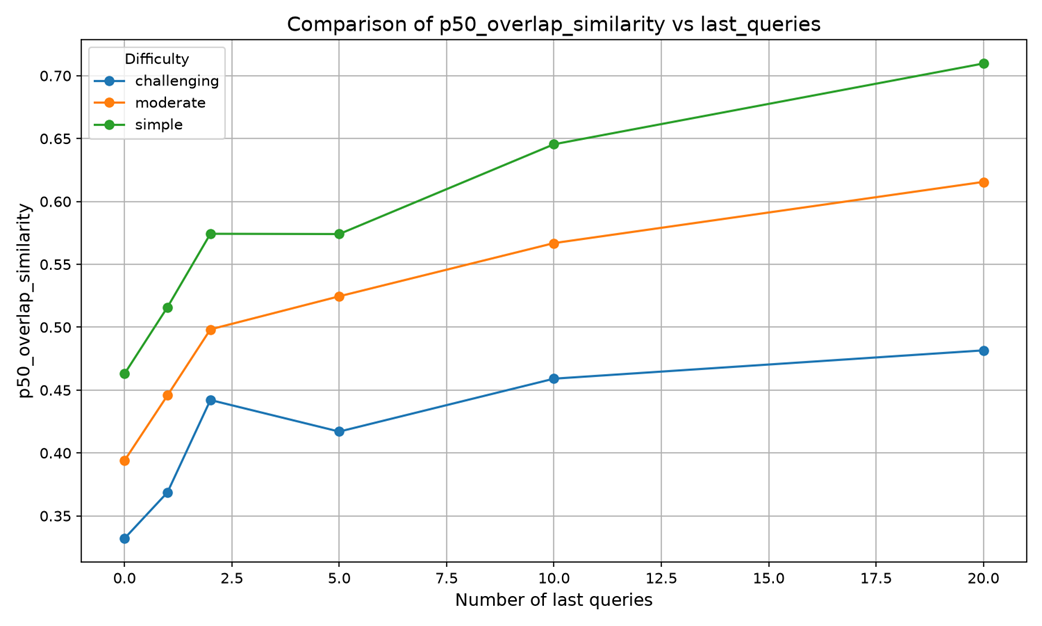
Compare p50 similarity across query-history sizes to see where additional context yields smaller gains. section 6.4.1
When to stop optimizing costs
An optimization sequence cut monthly cost from $8,754 to $5,100 with a 30-minute meeting, then to $2,500 after four steps. Later work reduced the bill further, but the final step saved $493 per month and took a week. Compare the effort cost with the recurring savings over the relevant period before taking another step; a smaller bill alone does not prove the work is worthwhile. section 9.2.8
Table 9.4 Cumulative optimization impact
|
Problem Solved
|
Monthly Cost
|
Savings
|
Effort
|
|
Baseline (Sonnet everything)
|
$8,754
|
-
|
-
|
|
Wrong tool for the task
|
$5,100
|
−$3,654
|
30-min meeting
|
|
Context waste
|
$4,200
|
−$900
|
2-hour audit
|
|
One model for everything
|
$3,300
|
−$900
|
1 afternoon
|
|
Output verbosity
|
$2,500
|
−$800
|
1 hour
|
|
Everything synchronous
|
$1,900
|
−$600
|
1 day
|
|
One tool for all workflows
|
$1,407
|
−$493
|
1 week
|
|
Total reduction
|
$8,754
→ $1,407
|
84%
|
~2 weeks
|
Inspect the cumulative cost, savings, and effort for each optimization step. section 9.2.8