Expected activity time is the duration assigned to a project activity after combining three estimates: optimistic time, most likely time, and pessimistic time. PERT uses their weighted average when detailed historical information is unavailable, supporting project forecasting and scheduling. section 13.2
Estimate an activity’s duration by:
- Collecting an optimistic time, assuming unusually favorable conditions. section 13.2
- Collecting a pessimistic time, assuming unusually unfavorable conditions. section 13.2
- Collecting the most likely time under normal conditions. section 13.2
- Calculating the PERT weighted average and assigning only the resulting expected time to the activity. section 13.2
- Using the resulting durations in forward and backward passes to calculate earliest and latest schedule times and identify the critical path. section 13.3 section 13.3.1
Automated reporting tool
For Activity A, the optimistic estimate is 2 weeks, the most likely estimate is 3 weeks, and the pessimistic estimate is 4 weeks. The resulting expected activity time is 3 weeks, which becomes the duration assigned to Activity A. Across all listed activities, expected times sum to 39 weeks, but parallel work means this is not the project duration; the network analysis gives a 29-week timeline. section 13.2 section 13.3.1
Figure 13.1 An illustration of the beta probability distribution assumed by PERT that displays the optimistic, pessimistic, and most likely activity times. The area under the curve represents the probability of different completion times, with the peak indicating the most likely duration.
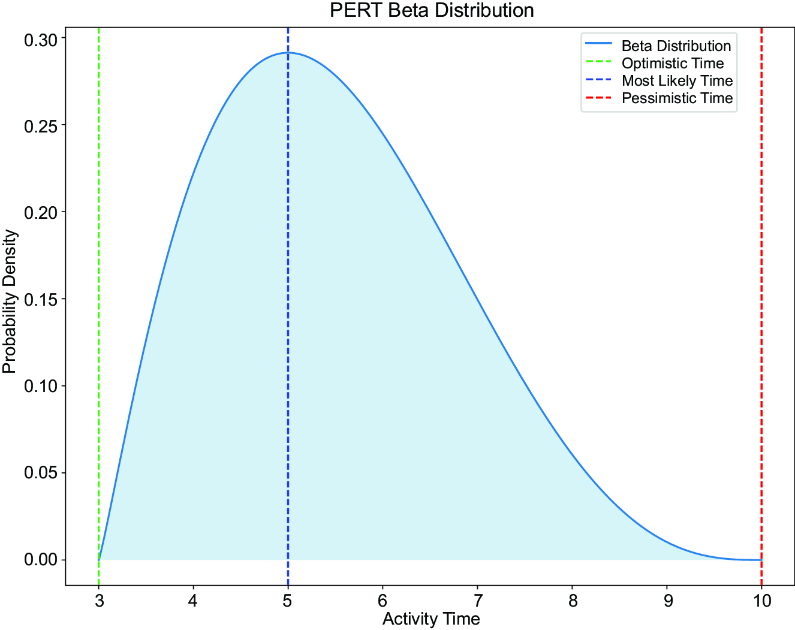
Visualizes the beta probability distribution assumed by PERT, including optimistic, most likely, and pessimistic times and the probability area between them. section 13.2
