Expresses a signal as components associated with different frequencies. For graphs, the signal is a vector or matrix of node features, allowing frequency-domain analysis of graph structure. section 3.4.1
A graph-based workflow proceeds as follows:
- Represent node features as a graph signal. section 3.4.1
- Transform the graph signal into a frequency representation. section 3.4.1
- Use spectral convolution ingredients such as the adjacency matrix, Laplacian matrix, and Laplacian eigenvectors. section 3.4.3
- Apply the inverse Fourier transform to recover a graph signal from its frequency representation. section 3.4.1
Figure 3.13 A random positive graph signal on the vertices of the graph. The height of each vertical bar represents the signal value at the node where the bar originates.
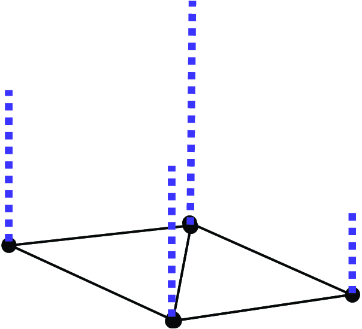
Visualizes a graph signal by drawing each node feature as the height of a bar at its originating node. section 3.4.1

