A Gaussian process (GP) is a probabilistic model of a function: at any finite set of inputs, its function values have a multivariate normal distribution. Rather than returning only one predicted value, it returns a predictive distribution, including a mean and uncertainty. Similar inputs are expected to produce similar predictions; the covariance function encodes that similarity and uncertainty. section 2.3 section 2.0
A GP can represent beliefs before observations and update them after data arrives. A prior GP can have a constant mean and confidence interval while sampled functions still show complex nonlinear shapes. After conditioning on observations, predictions smoothly interpolate nearby data and uncertainty shrinks around those observations while remaining larger farther away. section 2.4.4 section 2.6
In Bayesian optimization, a GP serves as the surrogate model for an expensive black-box objective:
- Train the GP on observed input–output pairs to form a belief about the objective across the search domain. section 1.2.3
- Provide mean predictions and uncertainty to a policy, which scores candidate points by their value for locating the global optimum. section 1.2.3
- Update the training data with the selected evaluation and repeat until the evaluation budget is exhausted. section 1.2.3
Exploration after a local optimum
On a one-dimensional objective, early evaluations can cluster near a local optimum. Once that region has been explored sufficiently, the GP-informed Expected Improvement policy shifts attention toward uncertain, promising regions near other parts of the domain, eventually locating the global optimum. section 1.2.4
A practical GPyTorch implementation defines mean and covariance modules and returns a multivariate normal distribution. With a Gaussian likelihood, prediction mode produces a predictive distribution whose mean, confidence region, and samples can be plotted. Training commonly minimizes negative marginal log likelihood with gradient descent; regular GPs can become slow and numerically unstable as datasets grow. section 2.4.3 section 12.1.2 section 12.1.3
Figure 2.18 Predictions made by a posterior GP. The mean function and randomly drawn samples smoothly interpolate the training data points, while uncertainty vanishes in the regions surrounding these data points.
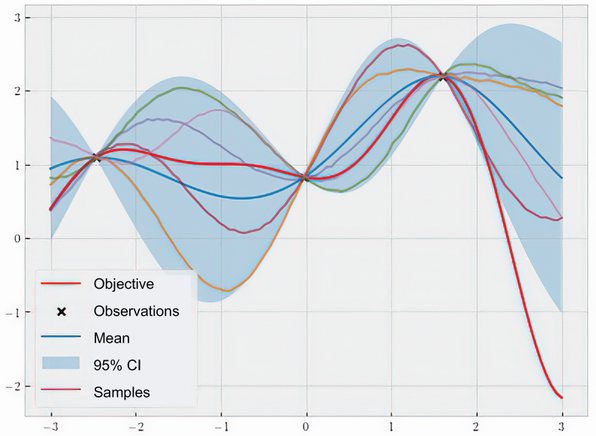
Compare posterior mean, sampled functions, and uncertainty around training points to see how observations constrain a GP. section 2.4.4


