A generalized linear model (GLM) adapts a linear predictor to the kind of target being predicted. Instead of treating every label as an ordinary real number, it pairs a linear model with a link function and a probability distribution. This makes one framework useful for real-valued measurements, positive skewed values, counts, binary outcomes, and multiclass labels. section 7.0 section 7.1.4
A regularized GLM has four parts: a probability distribution from the exponential family; a linear predictor, η = β0 + β′x; a link function relating the target to that predictor, g(y) = η; and a regularization function R(β). The distribution expresses what values and shapes are plausible for the target, while the link lets the linear predictor work on an appropriate scale. section 7.1.4
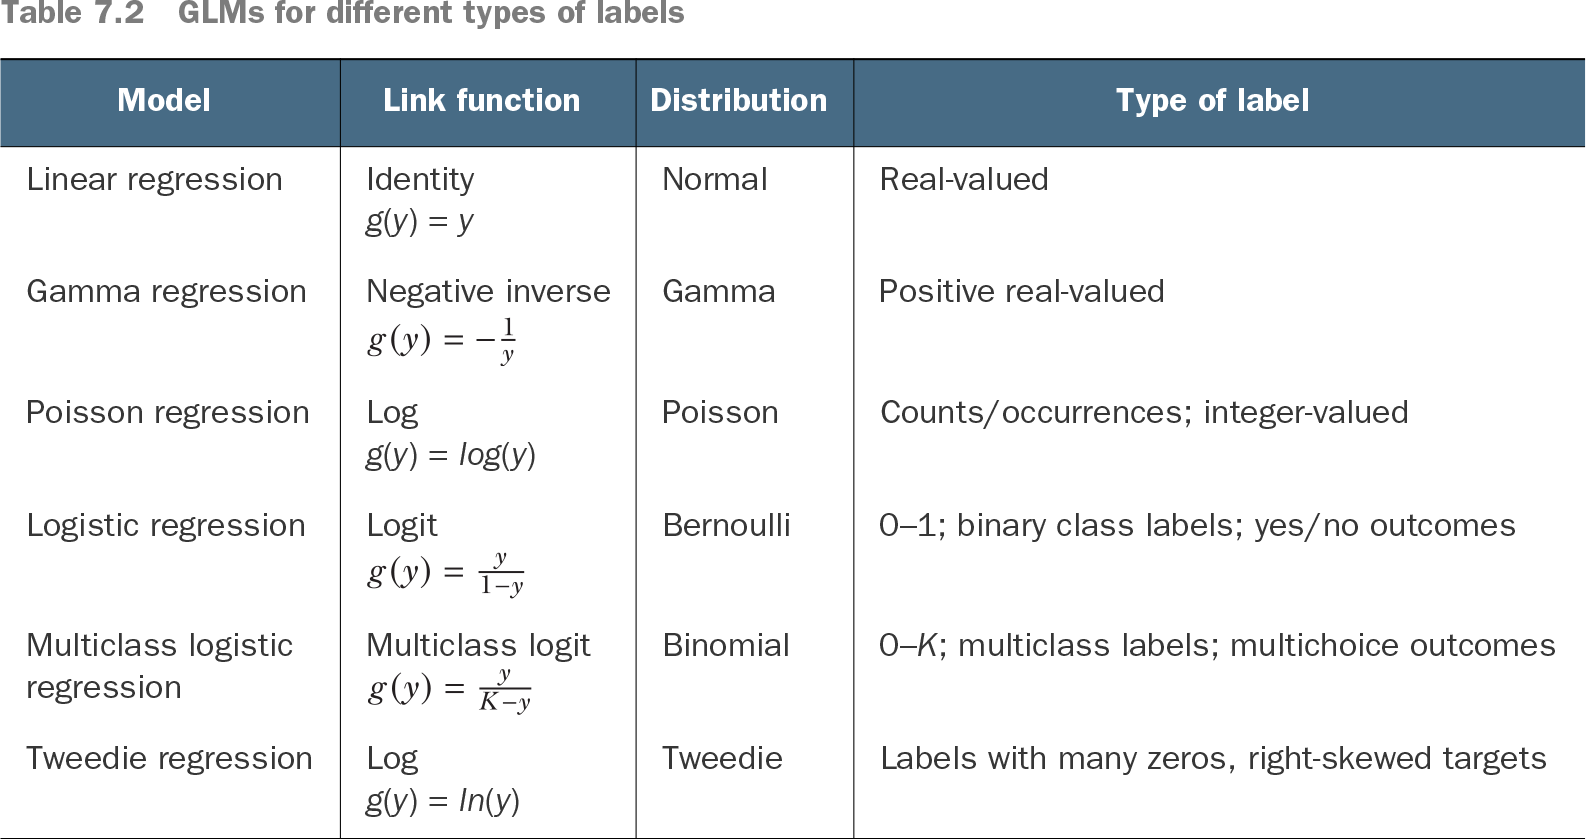
Choose a variant by matching the label pattern to a distribution and link function:
- Use linear regression with the identity link and normal distribution for real-valued targets. section 7.1.4
- Use Poisson regression with a log link for integer counts or occurrences. section 7.1.4 section 7.5
- Use logistic regression with a logit link and Bernoulli distribution for binary yes/no outcomes; use multiclass logistic regression for 0–K labels. section 7.1.4
- Use gamma regression for positive, right-skewed continuous values, or Tweedie regression for targets with many zeros and a right-skewed component. section 7.1.4 section 7.5
Table 7.2 GLMs for different types of labels (view table figure)
Compare GLM variants by their link, distribution, and label type. The table is a practical starting point for selecting a model after inspecting the target distribution. section 7.1.4
Bike-rental counts
For casual bike-rental counts, a log transformation reveals many zero values and a right-skewed positive pattern. That suggests a Tweedie model with a log link; Poisson regression is another count-oriented candidate. A normal-distribution ridge baseline performs worse than Poisson and Tweedie variants in the reported comparison. Tune regularization with cross-validation and compare MSE, MAE, and R² on held-out data. section 7.4.1 section 7.4.2
GLMs are also useful beyond standalone prediction. Their linear, additive structure makes coefficients interpretable as feature contributions on the link scale. In logistic regression, coefficients describe changes in log-odds: increasing a feature with a positive weight increases the odds of a positive class, while a negative weight decreases them. GLMs can also act as base learners in stacking and gradient-boosting workflows, although ensembles can move beyond their linear restriction. section 9.1.3 section 7.1.4 section 7.4.1
Interpreting a diagnosis model
In a logistic model for diabetes diagnosis using age and blood-glucose features, each feature weight changes the predicted log-odds additively. A one-unit age increase with weight 0.5 corresponds to odds multiplied by e^0.5, while a feature with weight −0.29 reduces odds by a factor of e^−0.29. This interpretation follows directly from the linear predictor and logit link. section 9.1.3