A generalized linear model matches a tabular prediction problem with a response distribution suited to the target rather than forcing every outcome into ordinary regression. This is useful when prices have heavy tails or when targets represent counts, positive costs, or combined frequency and severity. section 4.3.4
Choose the distribution according to the target:
- Normal supports ordinary regression and unrestricted values. section 4.3.4
- Poisson suits zero or positive event counts, such as annual insurance claims or production interruptions. section 4.3.4
- Gamma suits positive costs or durations, while Tweedie combines Poisson-like frequency with Gamma-like severity. section 4.3.4
- Inverse Gaussian handles nonnegative, positively skewed data. section 4.3.4
Testing Airbnb price distributions
A TweedieRegressor can compare normal, Poisson, Tweedie, Gamma, and Inverse Gaussian assumptions on the full Airbnb NYC price distribution. In the reported experiment, Poisson and Tweedie produced lower root mean squared errors than the other tested choices. Zero or negative targets require an offset for distributions restricted to positive values. section 4.3.4
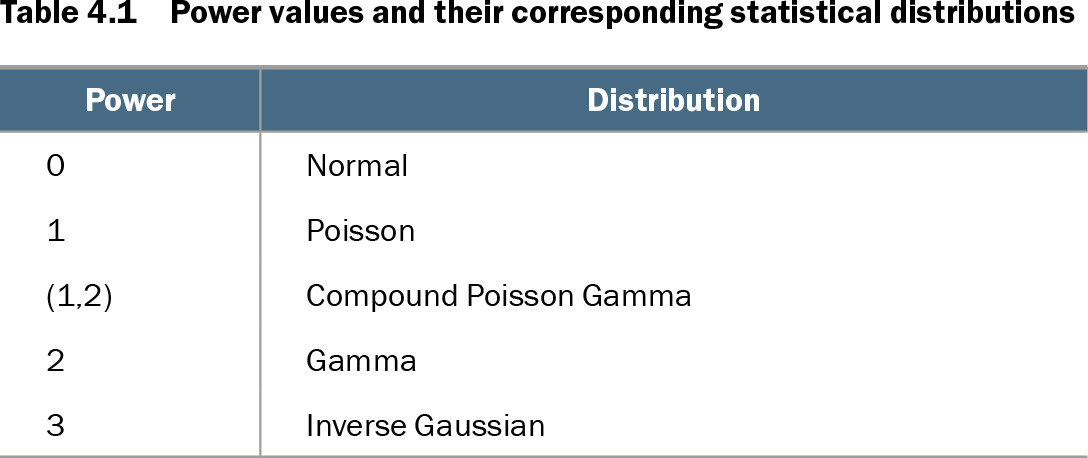
Table 4.1 Power values and their corresponding statistical distributions (view table figure)
| Power |
Distribution |
|---|---|
| 0 |
Normal |
| 1 |
Poisson |
| (1,2) |
Compound Poisson Gamma |
| 2 |
Gamma |
| 3 |
Inverse Gaussian |
Use the power-to-distribution table to select a TweedieRegressor setting: 0 for Normal, 1 for Poisson, 1.5 for compound Poisson-Gamma, 2 for Gamma, and 3 for Inverse Gaussian. section 4.3.4