A heat map is a color-encoded matrix that represents values for combinations of two dimensions. For two categorical features, each cell shows the count or proportion associated with a pair of category values, making unusually sparse or comparatively low combinations visible. section 2.3.2
Use heat maps as an exploratory view of categorical relationships and potential outliers:
- Compare the cells across category pairs to find non-zero combinations that are low relative to the others. section 2.3.2
- Use the display as a first step in outlier detection, after checking the data through exploratory analysis for errors. section 2.3.2
- Treat the pattern as evidence for further investigation rather than a complete detector: heat maps work well for one or two categorical features but do not explain higher-dimensional outliers. section 2.3.2 section 8.1.2
Figure 2.15 Examples of visualization for two-dimensions, with two categorical features (left) and one categorical and one numeric feature (right)
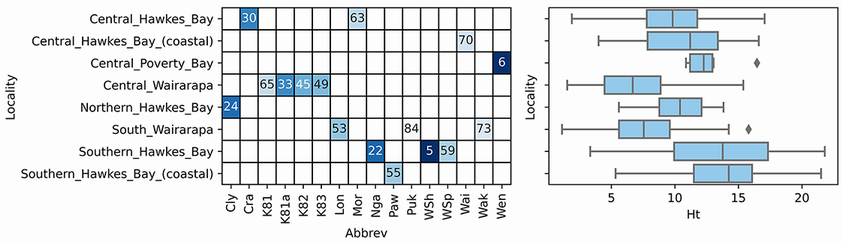
Compare the categorical-pair heat map with a boxplot for a mixed categorical and numeric pair; the contrast clarifies why each plot suits a different feature combination. section 2.3.2