Heteroscedasticity occurs when response variance changes across an independent variable instead of remaining steady. A widening, funnel-shaped spread is its practical visual signature. section 7.4
Use these checks before trusting a correlation or regression result:
- Plot the data rather than relying on a correlation coefficient or p-value; heteroscedasticity can make both misleading. section 7.4
- Look for variance that grows or shrinks across the independent variable, especially a pronounced funnel shape. section 7.4
- Experiment with logarithmic transformations of the independent or response values, while recognizing that transformation may not solve the problem. section 7.4 section 7.12
Bird strikes across altitude
Bird-strike incidents were grouped into 100-foot altitude bins and fitted with a linear regression. A logarithmic transformation produced a strong-looking negative Pearson correlation of -0.7692 and a tiny p-value, but the plot still showed severe skew and heteroscedasticity. The numerical result was therefore not useful; the pattern was real but not adequately linear. section 7.12
Figure 7.5 Anscombe’s quartet, showing four different datasets that have the same correlation coefficient and linear regression, yet have very different shapes
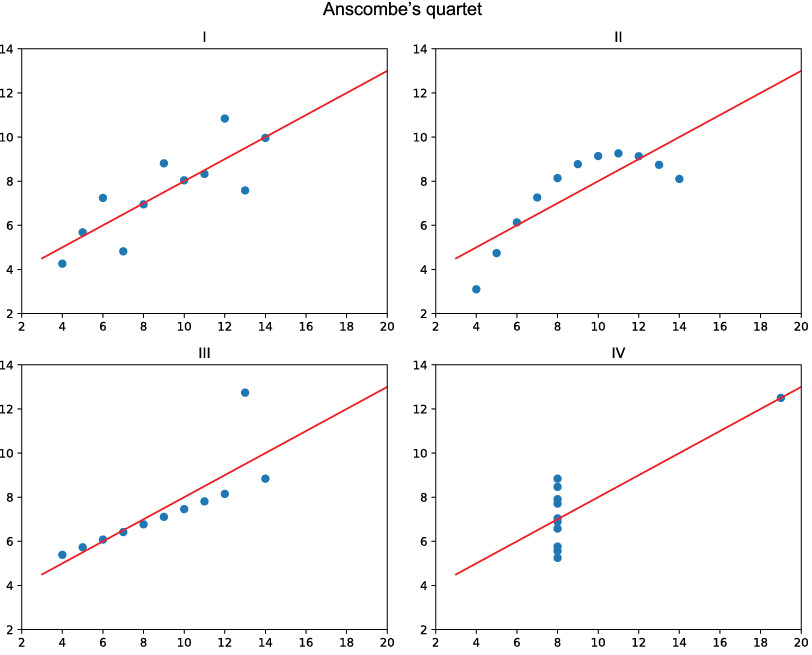
Compare datasets that share the same correlation and regression values but have different shapes, reinforcing why plots are necessary. section 7.4



