HTML is the standard markup language for structuring web pages and their content. HTML5 provides the page foundation for browser-based interfaces, including visualizations built with D3.js. section 1.5.4 section 12.3
A practical HTML workflow starts in VS Code with the Live Server plugin. From there, a developer can create a page, add a D3.js visualization, inspect the result, and refine it through small changes. section 1.5.4
A progressively refined HTML5 page can:
- Display data as a simple D3.js bar chart. section 1.5.4
- Add labels to the chart axes so viewers can interpret the visualization. section 1.5.4
- Add hover behavior that changes a bar’s color and displays its value. section 1.5.4
- Serve as an alternative to React-based frameworks when plain HTML, CSS, and JavaScript meet the interface need. section 12.3
Interactive bar chart
Start with data values for categories A through E, render a D3.js bar chart in an HTML5 page, then request or implement axis labels and hover feedback. The result is a more communicative interface without requiring every implementation detail to be known in advance. section 1.5.4
Figure 1.8 Simple bar chart
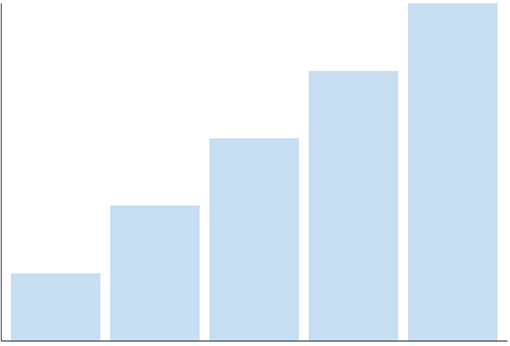
Use the simple bar-chart figure as a visual reference for how an HTML5 page can host a D3.js visualization. section 1.5.4