An insight is a meaningful, significant interpretation drawn from data: a pattern, relationship, or result worth communicating. It turns raw values into information by identifying what matters for a particular audience and decision. A chart alone is not an insight; it may merely redraw a table unless it helps reveal a useful conclusion. section 6.0 section 1.4.1
Start with the audience and its questions. Decide which data are relevant, inspect the values, and state the finding at an appropriate level of detail. The result should be a clear main point, not a collection of numbers. Context can then explain why that point matters, and a call to action can propose what to do next. section 1.4.1 section 5.2.1
From pet counts to a usable finding
A pet-event table lists 1,138 cats, 130 dogs, and 17 other pets. A bar chart of the counts adds little by itself. After focusing on participation percentages and removing the negligible Other category, the finding becomes memorable: roughly 9 of 10 participating pets are cats and 1 of 10 is a dog. That insight can guide a promotion decision, such as whether to focus effort on underrepresented groups. section 1.4.1
Look for insights through several complementary strategies:
- Connect separate observations to find a relationship or a new way of viewing existing data. section 6.1 section 6.1.1
- Notice coincidences: repeated or apparently random events that seem related. section 6.5
- Follow curiosity toward strange events, including missing values and anomalies. section 6.5
- Investigate contradictions with skepticism when evidence conflicts with an expectation. section 6.1.4 section 6.5
Question an unexpected sales pattern
If product sales rise after a price increase, resist treating the surprising pattern as a complete explanation. Examine it more deeply: perceived exclusivity, urgency, or inflation are possible interpretations offered for the result. The insight begins with the contradiction; exploratory analysis and experience are needed to assess its meaning. section 6.1.4
Once identified, an insight becomes the central point of a data story. Choose story characters and a chart that make the point legible, then add textual context. When describing it for an AI prompt or narrative, distinguish the scenario and data from the insight itself, and name the key pattern, trend, correlation, or relationship discovered. section 6.0 section 7.3.1
Figure 5.11 The flow to build a data story
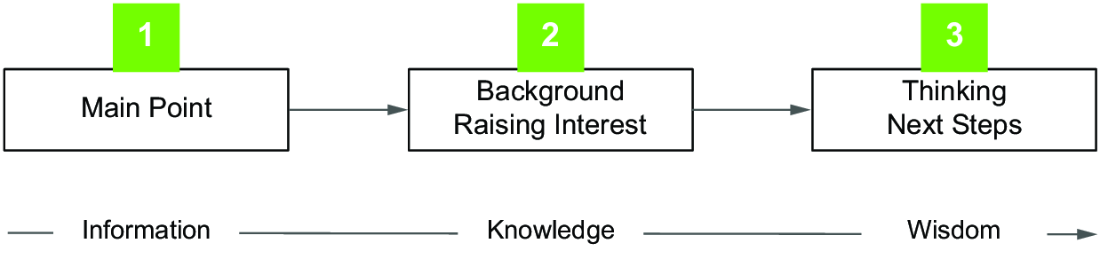
Use the flow diagram to place insight extraction first: establish the main point, add background context, then define next steps for the audience. section 5.2.1