Instrumentation adds code or integration components that emit telemetry while software runs. Treating it as code makes metrics, logs, and traces part of development rather than an afterthought, so teams can connect system behavior to changes and investigate failures. section 2.2.2
A practical instrumentation pattern includes:
- Embed metrics, logs, and traces directly in the system. section 2.2.2
- Capture contextual data and use distributed tracing to follow behavior across services. section 2.2.2
- Define actionable metrics and structured logs for health, performance, and errors. section 2.2.2
- Apply baseline observability through platform integrations, then add detailed language-level spans where they provide value. section 5.3.4
- Include observability instrumentation in CI/CD deployment workflows and in the definition of done. section 5.3.4
Instrumenting a control
A throttling control can emit uniquely tagged event data when its threshold triggers. Deployment pipelines can also log every change, allowing operational telemetry to be tied to what changed and when. This makes healthy guardrail behavior distinguishable from service failure and exposes unexpected source errors earlier. section 2.2.2
Figure 2.8 With every change you make to the platform, think about the kind of data you will need to understand how the new technology, service, or feature is behaving. Alerting from service failure is not enough. When we deploy automatic configuration behavior or control guardrails, even healthy behavior could be interpreted as failure.
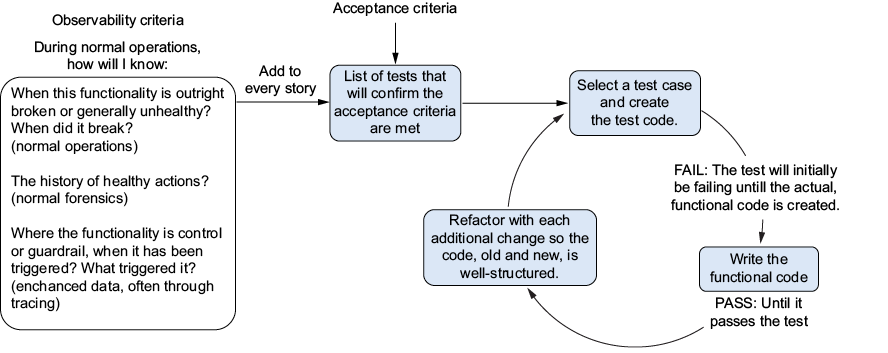
Use the figure to assess telemetry needs whenever a platform technology, service, feature, automatic configuration, or control guardrail changes. section 2.2.2