Jaeger provides a tracing and performance-monitoring view of microservices. Instrumented services send OpenTelemetry data to a collector; the Jaeger UI lets operators find traces by service and inspect request flow and latency. Prometheus stores time-series data used for performance graphs and percentile metrics. section 9.2.3 section 9.2.4
To add Jaeger to a Kubernetes deployment:
- Install the Helm chart containing Jaeger All in One, an OpenTelemetry Collector endpoint, and Prometheus. Check that their pods are running in the jaeger namespace. section 9.3 section 9.3.4
- Configure each Go service’s OpenTelemetry tracing provider with a Jaeger exporter, the collector URL, and resource attributes such as service name and environment. Batch exported data. section 9.3.5
- Add the OpenTelemetry gRPC server interceptor and configure trace-context propagation so calls between services remain visible as one request flow. section 9.3.5
Follow an order request
When an Order service calls a Payment service, propagated trace metadata connects their work in the Jaeger tracing UI. Search for the service to inspect the request path and its latencies; use the performance view to examine latency distributions over time. section 9.3.5 section 9.2.4
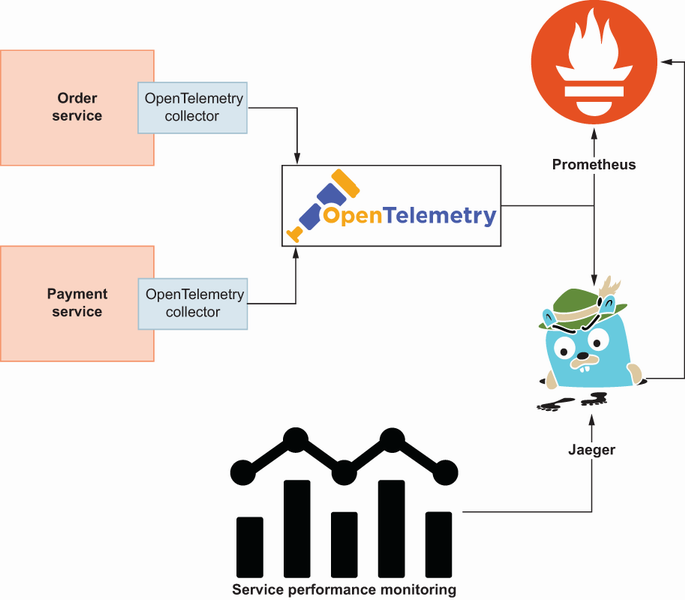
The service-performance view illustrates where to inspect latency graphs alongside trace queries. section 9.2.4



