Jaeger is an open-source distributed tracing system that collects spans from instrumented services and displays them as timelines. It helps reconstruct one request across HTTP, gRPC, and message queues when separate logs show only fragments. section 12.1.1
A trace ID links the spans belonging to one request. Jaeger groups those spans so you can inspect service boundaries, durations, errors, and delays rather than investigate each service in isolation. section 12.1.1
Use Jaeger to investigate questions such as:
- Which service or operation accounts for most of the request time? section 12.1.1 section 12.1.2
- Where did a request stop, lose its trace ID, or encounter an error? section 12.1.1
- How does a request move through synchronous calls and asynchronous messaging? section 12.1.1
Finding a missing order
A checkout service calls the order service through REST, which publishes an event to Kafka for fulfillment. The order service logs successful creation, but fulfillment shows no order. A Jaeger trace can expose the handoff: the span tree may show the Kafka publication, while a related warning identifies deserialization failure for the unknown enum value SHIPPING_METHOD_DRONE. This distinguishes a missing database write from a downstream message-consumption problem. section 12.1.1
OpenTelemetry generates the spans, either through manual instrumentation or its Java agent. Jaeger receives exported trace data through protocols such as OTLP or gRPC and provides a web interface for searching and exploring traces. Installation and operation belong to the surrounding platform infrastructure. section 12.1.2
Figure 12.3 OpenTelemetry collects relevant data from the running service. Jaeger and Zipkin are tools that aggregate and display nicely this data to help you easily troubleshoot the system.
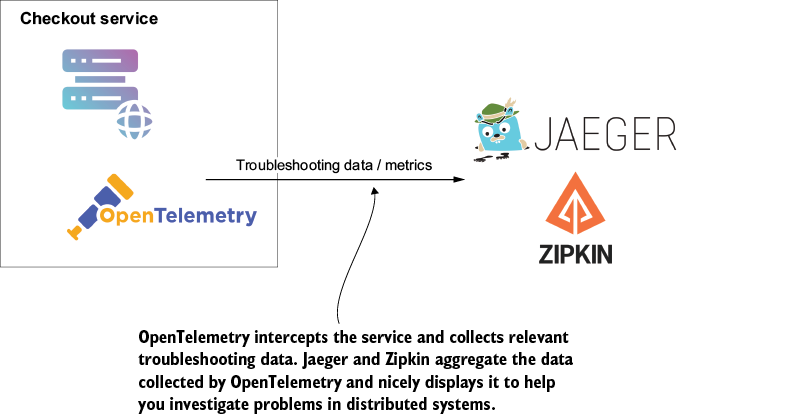
Use the architecture diagram to follow the path from a running service through OpenTelemetry to Jaeger’s aggregated trace view. section 12.1.2



