Cross-validation estimates how a machine-learning model will perform on future data drawn from the same distribution as the training data. Rather than trusting one train/validation split, it repeatedly trains on subsets of the available data and evaluates on the held-out portion. This makes it a standard basis for comparing tabular-data models before fitting a selected approach on all available data. section 4.1 section 4.3
In K-fold cross-validation, data is divided into K folds. Each fold serves as validation once while the remaining folds train the model, so every observation is evaluated as held-out data. Fold-level metrics are then aggregated, commonly with a mean or median; reporting the average and standard deviation helps compare both expected error and performance consistency across samples. section 4.3 section 7.2.3
Figure 4.9 How data is distributed between train and validation across the folds of a five-fold cross-validation strategy
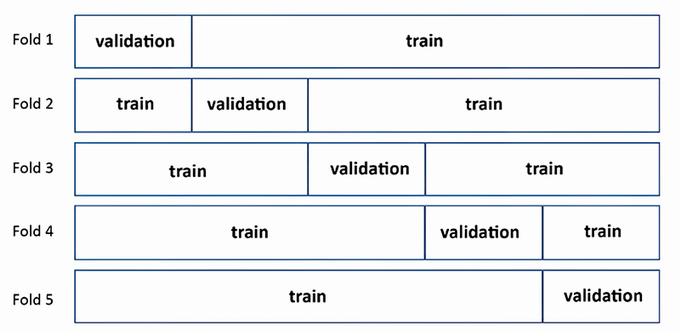
A five-fold layout makes the rotation concrete: every fold takes a turn as validation while the others provide training data. section 4.3
Build a useful cross-validation workflow by:
- Putting feature transformations and the model in one pipeline, so they are evaluated together. section 4.1 section 4.3
- Selecting an evaluation measure suited to the task, such as RMSE for regression or accuracy for balanced classification. section 4.3
- Using the same validation strategy and metrics when comparing candidate models. section 4.3
- Refitting the accepted pipeline on all data after cross-validation results are suitable. section 4.1
The split strategy must reflect the data. Ordinary K-fold works well in many cases, but stratified K-fold preserves the distribution of a chosen feature in every fold. For geographically influenced real-estate values, preserving a similar territory mix avoids folds that poorly represent the full dataset. Small groups may need preparation before splitting; otherwise, they cannot be represented reliably across folds. section 7.2.1
Diagnosing a real-estate baseline
Cross-validation can produce held-out predictions for every training case, not only a summary score. A linear-regression baseline for accommodation prices uses validation-fold predictions to calculate R-squared, RMSE, and MAE, inspect implausible negative predictions, and compare predictions with actual targets. This exposes underfitting or overfitting patterns across subsets of the data. section 7.2.3
Cross-validation also supports hyperparameter optimization. Define a search space, choose evaluation metrics, and use an appropriate validation scheme so settings are selected for generalization rather than merely for favorable results on the available data. For tabular deep learning in Keras, repeated randomized training runs with train, validation, and test proportions are presented as providing these benefits naturally. section 6.3 section 9.4.1











