A knowledge graph is an evolving, domain-specific graph data structure containing typed entities, attributes, and meaningful named relationships. It integrates structured and unstructured data into knowledge usable by humans and machines. Nodes can represent diseases, drugs, proteins, people, or organizations; relationships express connections such as a disease causing symptoms or a gene encoding a protein; properties add contextual details. section 1.0 section 1.4.1
A practical knowledge graph combines four capabilities:
- Evolution: continuously ingest, integrate, and extend information without overhauling the existing structure. section 1.4.1
- Semantics: make meaning explicit through types, relationship names, taxonomies, ontologies, and rules that support reasoning and explainability. section 1.4.1 section 1.6.1
- Integration: connect heterogeneous structured and unstructured sources through shared meanings, identifiers, formats, and provenance. section 1.4 section 4.0
- Learning: support querying, visualization, inference rules, machine learning, and graph-based analysis over the connected domain model. section 1.4.1 section 6.4
Build a knowledge graph around a task rather than importing every available dataset. First identify the business problem, domain scope, and useful data. Then model a schema with room for extensions, load an ontology or partial ontology, ingest sources, map entities and relationships, reconcile identifiers, validate integrity, and analyze the resulting graph. Structured sources such as CSV, relational databases, and APIs favor traditional integration; unstructured text adds NLP, entity extraction, relation extraction, resolution, and validation. section 2.6 section 3.3 section 4.0 section 5.0
Biomedical knowledge graph
A clinical graph can connect patients, drugs, diseases, proteins, and treatments while combining electronic health records, multi-omics datasets, ontologies, and biomedical databases. A graph query can filter protein–disease associations by identifiers, relationship score, and disease hierarchy, then return the connected entities, relationship type, weight, and source. An LLM may summarize these findings for clinical decision support, but physicians and researchers must interpret the results. section 4.4 section 4.4.1
Figure 1.1 Example KG in the healthcare domain. Nodes (circles) represent entities, such as people, diseases, and anatomic parts. Edges (relationships) represent meaningful connections among entities. Nodes and edges have properties describing relevant details.
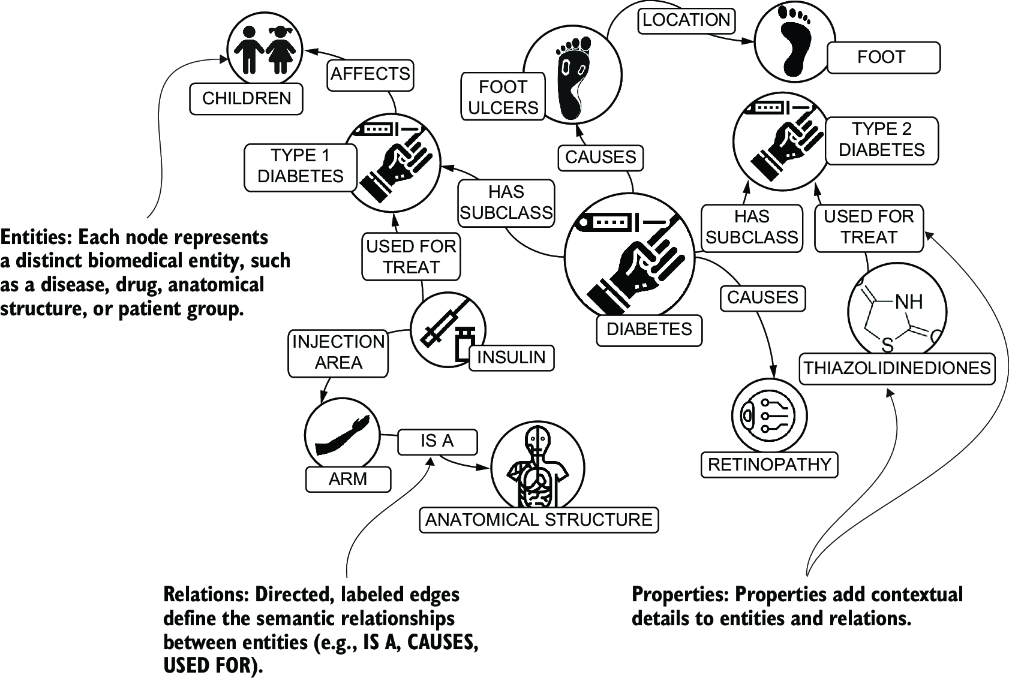
Use the healthcare graph illustration to inspect how entity nodes, meaningful relationship edges, and properties form a domain model. section 1.1