A safety monitor must decide whether an unusual reading warrants inspection. Setting the threshold too strictly can miss a fault; setting it too loosely can trigger unnecessary inspections. The significance level makes one part of that trade-off explicit before the data are analyzed. section 4.2.2 section 4.1.2
The significance level α is the maximum acceptable probability of a Type I error: rejecting the null hypothesis H₀ when it is true. A Type II error is failing to reject H₀ when it is false. For a specified test, choosing a smaller α generally reduces false positives but increases false negatives; choosing a larger α generally has the opposite effect. section 4.1.2
The conventional choice α = 0.05 traces largely to Ronald Fisher’s practical benchmark, not a universal rule. The choice should reflect the consequences of errors: α = 0.01 may be suitable when false positives are particularly costly, while α = 0.10 may be acceptable when missing a genuine effect is more costly. section 4.1.2
The critical region converts α into test-statistic values that lead to rejection, using the test’s sampling distribution under H₀. Equivalently, reject H₀ when the p-value is at or below the predetermined α. The p-value measures how unusual the observed result or a more extreme one would be under H₀; it is not the probability that H₀ is true. section 4.1.5 section 10.2.3
Figure 4.1 Illustration of critical regions in a two-tailed hypothesis test at the 5% significance level. The curve represents the distribution of the test statistic under the null hypothesis. In a two-tailed test, the rejection regions are placed symmetrically in both extremes of the distribution, with 2.5% in each tail, so that results unusually far from the center in either direction would lead to rejecting the null. By contrast, a one-tailed test would place the entire 5% rejection region on only one side of the distribution, used when deviations are meaningful only in a single direction. This figure provides one example of how critical regions formalize the decision rule in hypothesis testing.
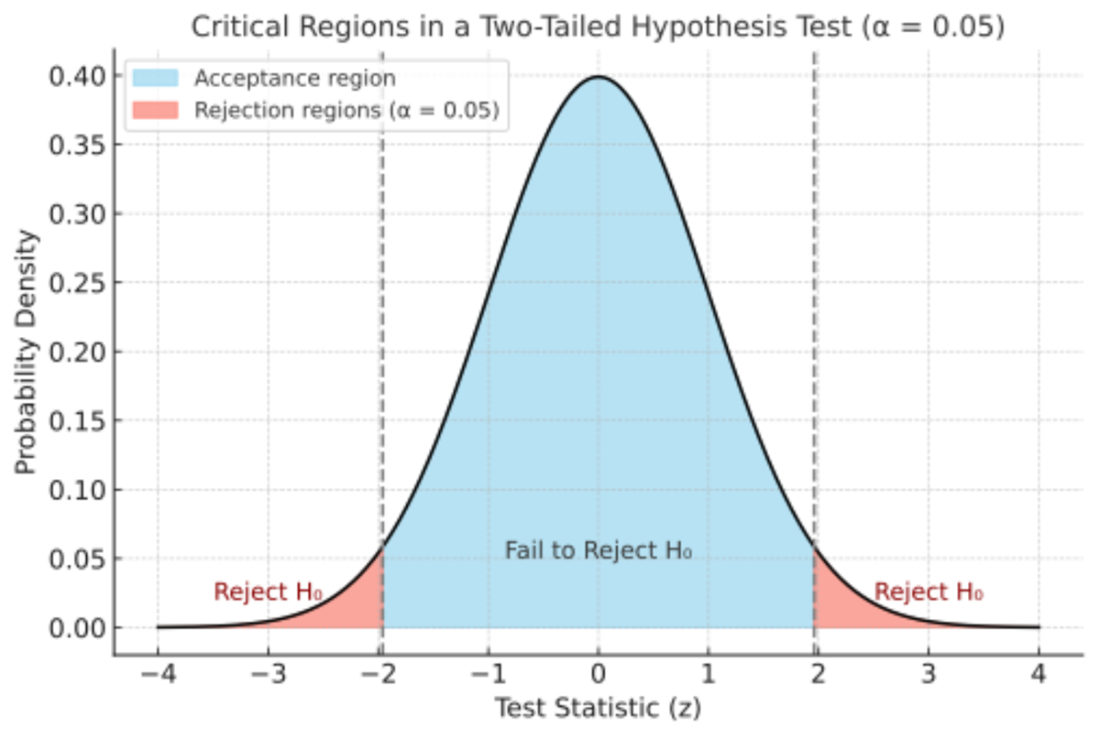
A two-tailed test at α = 0.05 places 2.5% of the null distribution in each rejection tail; a one-tailed test places the full 5% in one tail. section 4.1.5
Aircraft vibration monitoring
If only unusually high vibration suggests a fault, an airline can use a one-tailed test and choose α = 0.10. The higher threshold makes inspection more likely, accepting more false alarms to reduce the chance of overlooking a fault. section 4.2.2
A rejection is a decision under controlled risk, not certainty about the true state. Sample size and the magnitude of an effect also influence Type II error and statistical power. section 10.2.3

