A decision boundary is the surface that separates regions of an input space assigned to different classes. Each input instance is a point in that space; classification amounts to determining which side of the boundary the point lies on. In high-dimensional spaces, the boundary is a hypersurface rather than an ordinary two-dimensional curve. section 3.1.2
Figure 3.1 Geometric depiction of a classification problem. In the multidimensional input space, each data instance corresponds to a point. In figure 3.1a, the points marked c denote cars, and points marked g denote giraffes. This is a simple case: the points form reasonably distinct clusters, so the classification can be done with a relatively simple surface, a hyperplane. The exact parameters of the hyperplane—orientation and position—are determined via training. In figure 3.1b, the points marked h denote horses, and those marked z denote zebras. This case is a bit more difficult: the classification has to be done with a curved (nonplanar) surface, a hypersphere. The parameters of the hypersphere—radius and center—are determined via training.
|
(a) Car vs. giraffe classifier |
|
(b) Horse vs. zebra classifier |
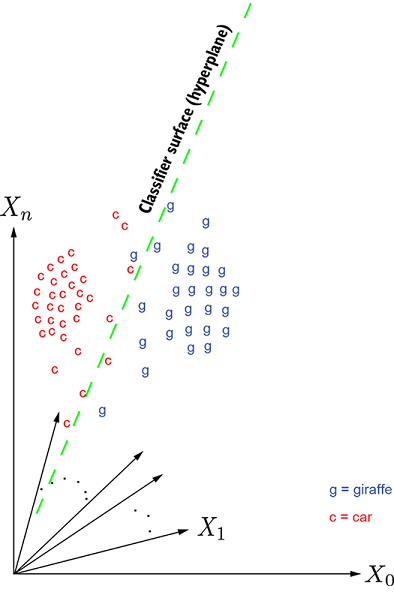
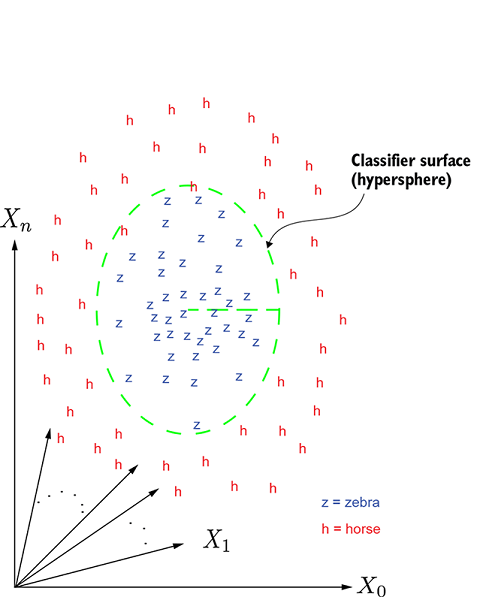
Compare a case with clustered classes separable by a hyperplane to one requiring a curved hypersphere. Training determines the boundary's position and orientation or shape. section 3.1.2
A binary boundary can be represented by a surface function whose zero-valued points lie on the separator. For the line y + 2x + 1 = 0, a point (x0, y0) is classified by the sign of y0 + 2x0 + 1: negative and positive values identify opposite half-planes. section 3.1.4
Modeling a classifier means estimating a useful decision boundary from labeled samples:
- Choose a function family: linear models suit simple separations, while nonlinear models can represent more complex surfaces. section 3.1.3
- Train its parameters so known inputs receive their ground-truth classes as closely as possible. section 3.1.3
- Seek representative samples across each class region; poorly spanning samples can yield a poor boundary. section 7.2.2
Why a straight boundary can fail
For a threat-versus-not-threat classifier using hardness and sharpness, the actual dividing curve changes its sharpness threshold as hardness rises. A straight-line approximation is easier to represent but misclassifies points between itself and the curved boundary. XOR provides an even sharper limit: its two positive points and two negative points cannot be separated by one straight line, so one perceptron cannot model it; multiple perceptrons can. section 7.2.2 section 7.4.1
Decision boundaries also appear in score space. For two class scores, s0 = s1 is the boundary at which the selected class changes. Argmax produces a discontinuous step across it, while softmax gives a continuous approximation whose probabilities vary smoothly as the scores change. section 9.1.5



