An exponential growth curve increases at an accelerating rate. In the savings-account example, investing $1 at 8% annual interest gives the relationship y = 1.08^x, where x is years invested and y is the future balance. The formula works for whole or decimal values of x. section 3.1
Use the curve as a target shape for generated data: create pairs (x, y), train a GAN on those samples, and use its generator to produce new pairs that mimic the curve. Changing the training relation changes the generated shape. section 3.0 section 3.6
A practical workflow is:
- Choose an x range, such as 0 to 50, and calculate y = 1.08^x for each value. section 3.1
- Store the pairs in batches suitable for deep neural networks. section 3.2
- Train the GAN: the generator creates samples from a random noise vector, while the discriminator distinguishes generated samples from real curve samples. section 3.1
- Discard the discriminator after training and use the generator to create new samples resembling the target shape. section 3.6
Build and plot the training data
Create a PyTorch tensor with 2,048 rows and two columns. Fill the first column with random x values from 0 to 50, then set the second column to 1.08^x. Plotting the columns reveals the accelerating curve. Replacing the relation with sin(x) produces a different target shape. section 3.2.1
Figure 3.1 The steps involved in training GANs to generate an exponential growth curve and the dual-network architecture in GANs. The generator obtains a random noise vector Z from the latent space (top left) to create a fake sample and presents it to the discriminator (middle). The discriminator classifies a sample as real (from the training set) or fake (created by the generator). The predictions are compared to the ground truth and both the discriminator and the generator learn from the predictions. After many iterations of training, the generator learns to create shapes that are indistinguishable from real samples.
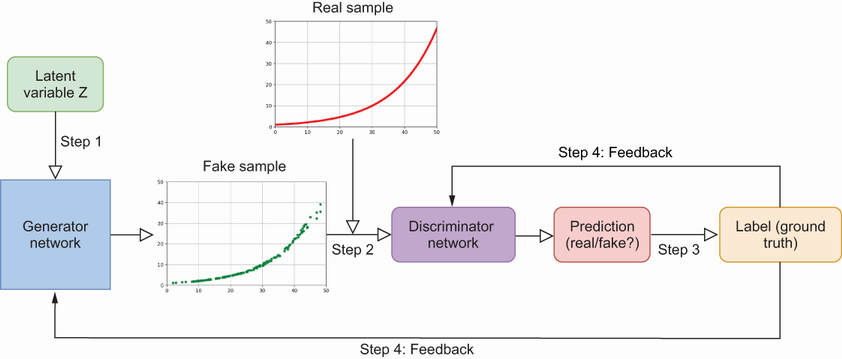
Trace the generator–discriminator loop from latent-space noise to generated samples, classification, feedback, and learned curve-like output. section 3.1
Listing 3.1 Creating training data to form an exponential growth shape
import torch

torch.manual_seed(0)                                #1

observations = 2048

train_data = torch.zeros((observations, 2))         #2

train_data[:,0]=50*torch.rand(observations)         #3

train_data[:,1]=1.08**train_data[:,0]               #4
Inspect the compact PyTorch listing that creates 2,048 exponential-curve training pairs. section 3.2.1
Listing 3.2 Visualizing the relation between x and y
import matplotlib.pyplot as plt

fig=plt.figure(dpi=100,figsize=(8,6))
plt.plot(train_data[:,0],train_data[:,1],".",c="r")    #1
plt.xlabel("values of x",fontsize=15)
plt.ylabel("values of $y=1.08^x$",fontsize=15)         #2
plt.title("An exponential growth shape",fontsize=20)   #3
plt.show()
Inspect the Matplotlib listing that plots the x and y values and labels the exponential-growth shape. section 3.2.1

