A local neighborhood answers a practical clustering question: which observations are close enough to a chosen point to count as nearby? Represent observations in a vector space, choose a point P and a radius ε greater than zero, and include every point whose distance from P is at most ε. In two dimensions this region is a circle; in three dimensions it is a sphere. section 2.5.1
Figure 2.26 Representation of data points in a vector-space diagram. On the right-side we have a point P, and the circle drawn is of radius ε. So, for ε > 0, the neighborhood of P is defined by the set of points that are at less than or equal to ε distance from the point P.

The circle makes the distance rule visible: points on or inside the radius belong to P’s neighborhood. section 2.5.1
Neighborhoods let density-based clustering compare nearby regions. The number of observations inside a neighborhood acts as its mass; its size determines its volume. Increasing ε increases the volume, but how many additional points it captures depends on the data distribution. Nearby regions with similar, high densities can form a cluster, while sparse regions can separate clusters or contain outliers. Relative density matters more here than a density value on its own. section 2.5.1 section 2.5
DBSCAN turns this idea into a threshold test. It uses ε for the neighborhood radius and minPts for the minimum number of points needed for a dense region. A point is a core point when its ε-neighborhood contains at least minPts observations, counting the point itself. With the same ε around every point, neighborhood size stays fixed while point counts vary. Connected core points allow a cluster to extend beyond any one point’s immediate neighborhood. section 2.5.2
Figure 2.30 X and Y are the core points, and we can travel from X to Y. Though Z is not in the immediate neighborhood of X, we can still reach Z from X through Y. This is the core concept of density-connected points used in DBSCAN clustering.
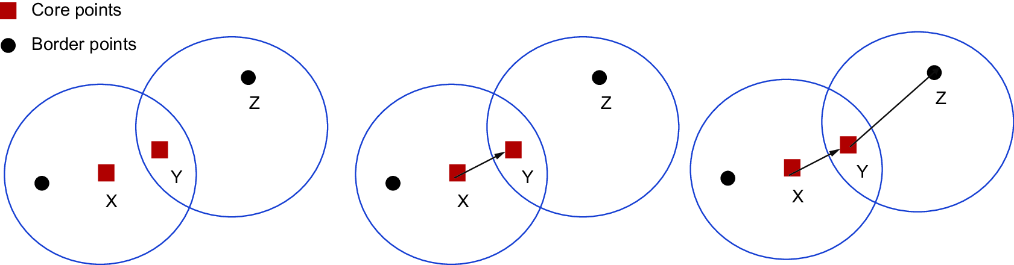
The diagram shows how a point outside one core point’s immediate neighborhood can still be reached through another core point. section 2.5.2
Choosing a radius in Python
On standardized feature data, fit scikit-learn’s NearestNeighbors with n_neighbors=2, sort each observation’s second-neighbor distance, and plot those distances to help choose ε. Then fit DBSCAN with eps as the radius and min_samples as the point threshold; inspect its labels and plot the resulting clusters. The radius is a modeling choice: changing it changes which observations share a neighborhood. section 2.5.2 section 2.5.1



