liveBook · Manning

Matplotlib

As explained in Geometry for Programmers

Matplotlib is a Python library for creating static, animated, and interactive visualizations.

Matplotlib is a Python library for drawing plots that make numerical and geometric ideas easier to inspect. It becomes useful when formulas or approximations need a visual explanation. section 6.2.3

Matplotlib supports practical mathematical communication by:

  • Turning application data into plots, such as workout times measured across rowing sessions. section 6.2.3
  • Showing how a linear approximation follows a trend and how polynomial approximation generalizes that idea. section 6.2.3
  • Working alongside SymPy for formulas and NumPy for numerical computations in application-focused examples. section 1.5

Plotting a trend in rowing times

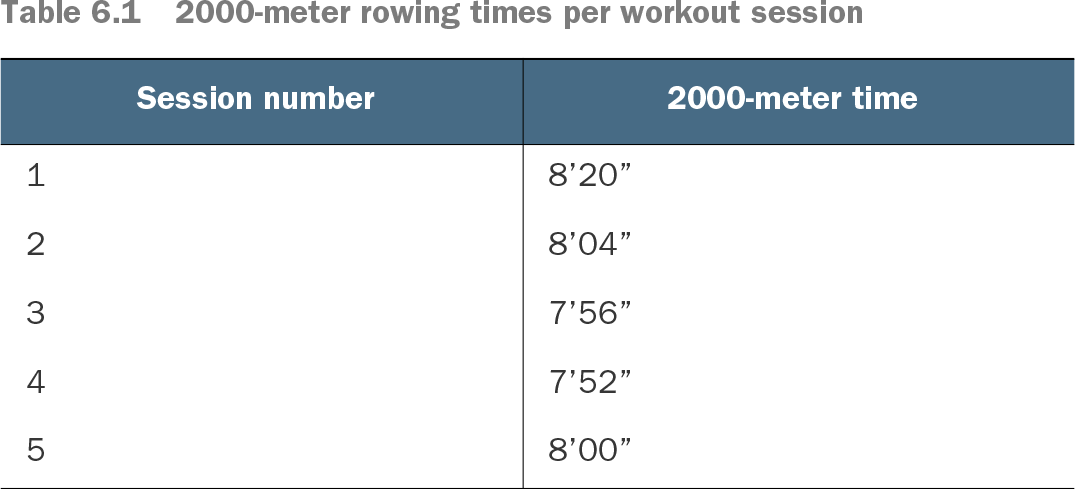
Represent five workout sessions and their 2000-meter times, then plot the measurements with an approximating line. The resulting figure makes the trend visible and gives the approximation a concrete geometric interpretation. section 6.2.3

Table 6.1 2000-meter rowing times per workout session (view table figure)

Session number

2000-meter time

1

8’20”

2

8’04”

3

7’56”

4

7’52”

5

8’00”

Inspect the session-by-session rowing measurements used as the concrete plotting data. section 6.2.3

How Geometry for Programmers covers it

How deep it goes
Introduces plotting as a practical aid but stops short of teaching Python or Matplotlib programming in detail.
Examples
Uses rowing-session times, an approximating polynomial, and figures comparing linear approximation with the observed trend.
What it assumes
Assumes elementary mathematics and readable Python snippets, while requiring no prior familiarity with Matplotlib, SymPy, or NumPy.
What you can do after
Apply Matplotlib to draw plots that clarify numerical trends and geometric behavior.
How it connects
Connects plots with polynomial approximation, SymPy, NumPy, and Python.

Also explained in

Compare how 4 books explain Matplotlib →

Related concepts

This explainer was generated by Manning's knowledge graph from the text of Geometry for Programmers. The section links point to the parts of the book it draws on.