A nonlinear mapping produces outputs that cannot be represented as a linear transformation of its inputs. Matrix-vector multiplication is linear; mapping a vector to its length provides a contrasting nonlinear example because it violates the required combination rule. In machine learning, nonlinearity lets models represent curved decision boundaries and approximate complex classification or estimation functions. section 2.10.2 section 1.6
Nonlinearity matters because it changes what a model can express:
- A weighted sum alone creates a linear model and cannot adequately fit a nonlinear data distribution. section 3.5.3
- Applying a sigmoid to a weighted sum supplies nonlinearity and supports more complex classification tasks. section 1.6
- Stacking nonlinear layers increases expressive power: lower layers can learn simpler features, while higher layers represent more abstract features. section 1.7 section 11.2
Fitting a quadratic function with PyTorch
For data generated by y = x² − x + 2, a linear prediction y_pred = b + wx cannot converge to the underlying curve. Adding a quadratic term gives y_pred = w₀ + w₁x + w₂x²; training then learns coefficients close to 2, −1, and 1. section 3.5.3
Figure 1.5 The sigmoid graph
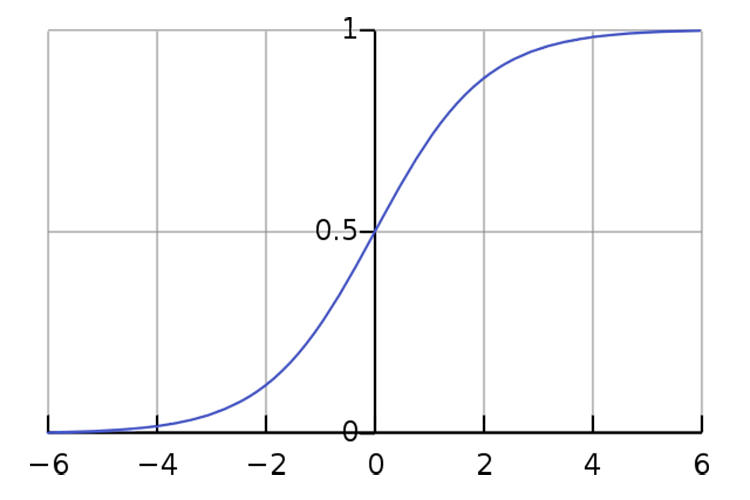
Use the sigmoid graph to connect the mathematical shape of a nonlinear function with its role after a weighted sum. section 1.6






