A p-value helps decide whether an observed difference is plausibly due to chance under a null hypothesis. Start by assuming nothing unusual is happening; a small p-value is treated as evidence strong enough to reject that assumption. A commonly used cutoff is 0.05: at or below it, reject the null hypothesis; above it, fail to reject it. section 5.5 section 20.2
Statistical significance depends on more than the size of a difference. Tests weigh group means or other results, variability, and the number of records. A small difference can be significant with enough data, while a larger difference may not be significant in a short data set. section 7.4.1 section 20.2
Use p-values in several common analytical checks:
- Check normality with a Shapiro-Wilk test before using variables as linear-regression predictors; retain distributions with p-values above 0.05 and exclude those below the cutoff. section 5.5.2
- Compare two continuous groups with a t-test, such as home versus road foul calls or free-throw attempts. section 7.4.1
- Test whether a correlation differs meaningfully from zero, such as correlations of wins with points allowed and points scored. section 14.4.2
- Identify regression predictors whose estimated relationships with wins meet the 0.05 significance threshold. section 5.7.3
Home and road personal fouls
A Welch two-sample t-test compares personal fouls per game for road and home teams in the 2018–19 regular season. The p-value is 0.02727, below 0.05, so the equal-means null hypothesis is rejected. The observed mean difference is about 0.38 fouls per game, illustrating that statistical significance and practical size are separate questions. section 7.4.1
Figure 20.2 Significance tests start with a null hypothesis that is subsequently rejected or not rejected based on a p-value with a 5% threshold. Which significance test to run is conditioned on the data (usually, but not always, continuous versus categorical). Significance tests are usually run from base R functions, and the results are typically visualized through packaged functions.
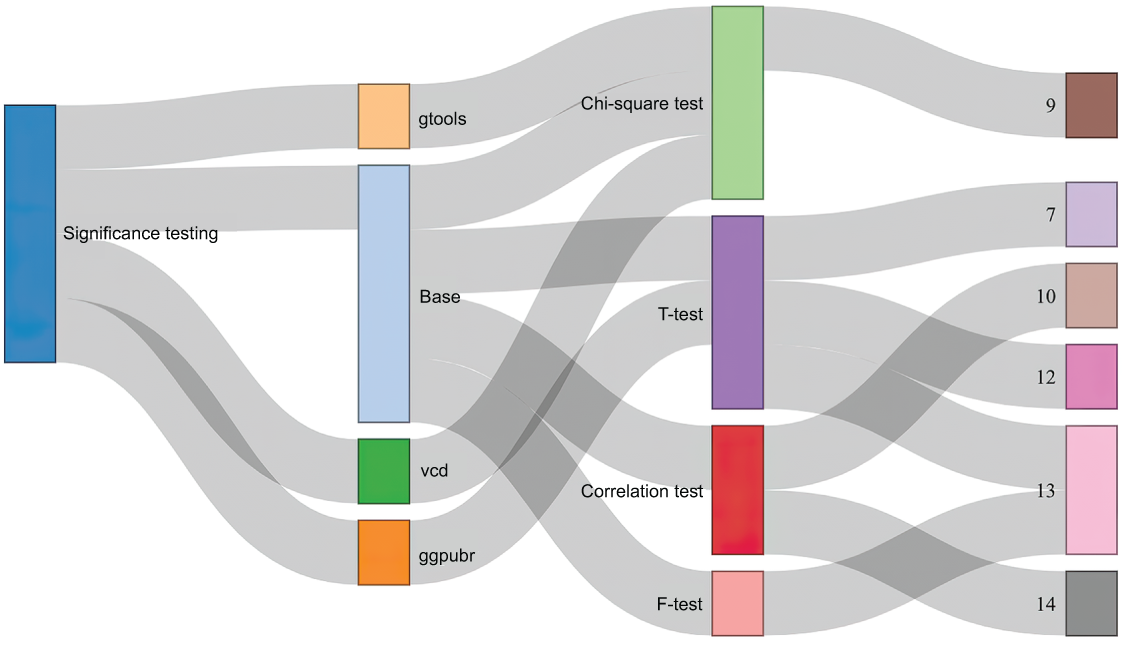
This decision map links the null hypothesis, a chosen threshold, test selection by data type, and the reject-or-fail-to-reject result. section 20.2
A p-value is a decision aid, not a complete verdict on importance. Pair it with the size of the difference, the data volume, visualizations, and model diagnostics before drawing a practical conclusion. section 7.4.1 section 5.7.6




