A p-value answers a narrow “how surprising is this?” question. Start by assuming the null hypothesis—the status-quo claim—is true. The p-value is then the probability of observing your sample result, or one even more extreme, under that assumption. A small value means the result would be unusual if the null hypothesis held, so it is evidence against that null. It does not give the probability that the null hypothesis itself is true or false. section 6.7 section 6.1
Eight cups of tea
Suppose someone claims she can tell whether milk or tea was poured first. In eight prepared cups, she identifies all four milk-first cups correctly. If she were only guessing, a random simulation finds that outcome about 1.4% of the time. That p-value, 0.014, says how often perfect identification would occur under the guessing assumption—not that there is a 1.4% chance she was guessing. The result is unusual enough under guessing to consider rejecting that null hypothesis. section 6.1
Figure 6.3 The p-value is the probability of values more extreme than your sample.
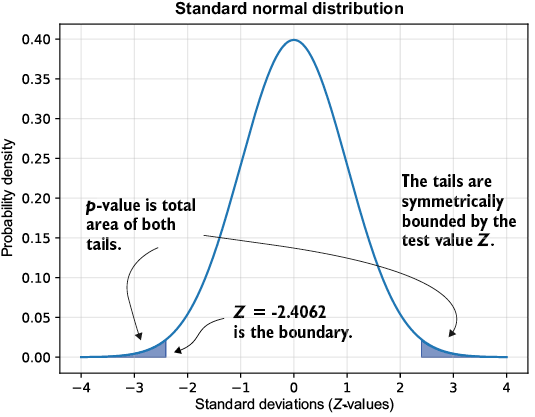
Use the shaded tails to see the key idea: the p-value includes outcomes farther from the null expectation than the observed result. section 6.7
To make a decision, choose a significance level α before judging the result, often 0.05. If p is less than α, reject the null hypothesis; otherwise, fail to reject it. “Fail to reject” is intentionally cautious: the data did not provide enough evidence against the null at that threshold, rather than proving it correct. The p-value is based on the observed test statistic, while α is a preset cutoff. section 6.7 section 6.15
The meaning of “at least as extreme” depends on the test direction:
- In a two-tailed test, include both distribution tails beyond the observed distance from the null value. Use this when a value being either higher or lower matters. section 6.7
- In a left-tailed test, use the area left of the test value; in a right-tailed test, use the area right of it. Use a one-tailed test only when one direction is the question. section 6.11
- For matching data and direction, a one-tailed p-value is often half the equivalent two-tailed value, making rejection easier at the same α. section 6.11
Are potato chip bags underfilled?
A sample of 41 bags has mean weight 140.2 grams, compared with an advertised mean of 142 grams. A left-tailed test asks whether the mean is below 142 and produces p = 0.0081. Since 0.0081 is below α = 0.05, reject the null hypothesis for that directional question. A two-tailed version gives 0.0161 because it also counts evidence on the opposite side. section 6.11
Python can calculate p-values from a test statistic rather than leaving you to hand-calculate tail areas. For a mean test, the calculation uses the sample mean, hypothesized mean, sample size, and spread; the standard normal distribution is used for samples over 30, while the t-distribution is preferred for smaller samples. Many practitioners use the t-distribution in all cases. Let code handle arithmetic, but keep the null assumption and test direction visible in the decision. section 6.11 section 6.15
P-values also test whether an observed Pearson correlation could plausibly arise from no linear correlation. With SciPy’s pearsonr, the null assumes uncorrelated, normally distributed underlying samples. A tiny p-value can support rejecting no linear relationship, but it does not establish causation. Sample size, dispersion, outliers, bias, and misleading plots still deserve scrutiny, so inspect the data rather than treating one metric as a truth machine. section 7.3 section 7.13




