P95 latency is the response-latency value at or below which 95 percent of observed requests fall. It describes the latency distribution more reliably than an average when a small number of slow requests would otherwise distort the result. section 9.1.2
Use percentile latency to interpret production behavior:
- Collect observed response latencies and order them before locating the requested percentile. section 9.1.2
- Read P95 as a user-facing threshold: a value of 46.79 ms means 95 percent of measured latencies are 46.79 ms or less. section 9.3.6
- Track percentile metrics over time rather than relying on a single aggregate value. section 9.2.4
In distributed services, percentile latency belongs alongside request rate and error rate. Jaeger can display service latency distributions and performance summaries from Prometheus time-series data, while traces help inspect request flow and related service or database spans. section 9.2.4 section 9.3.6
Order-service performance
A Jaeger service-performance view reports an Order-service P95 latency of 46.79 ms and a request rate of six requests per second. The percentile states the typical upper-bound experience for 95 percent of observed requests; traces and database-related spans support investigation of slower requests. section 9.3.6
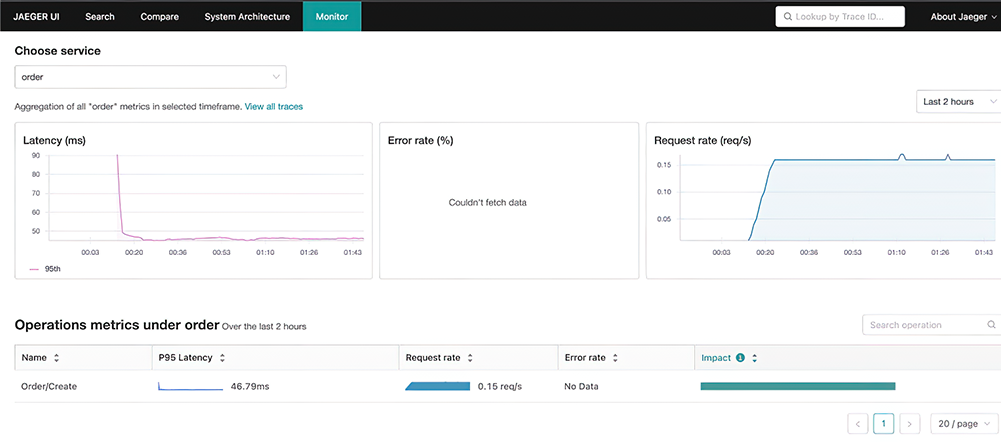
Inspect the Jaeger SPM performance summary showing P95 latency alongside request rate and error rate. section 9.3.6






