Percentile latency describes how slow requests are near the slow end of normal operation. The 95th-percentile read latency is the value at or below which 95% of database reads finish; the remaining 5% are slower. This makes it a practical way to assess the experience of users who encounter slow queries, rather than focusing only on an average. section 11.1.2
Track percentile latency alongside workload signals. A rise in reads in progress can help explain rising read latency after a feature rollout, while increased compactions can reveal another possible cause. Metrics exposed by Scylla can be scraped into Prometheus, where their changes over time can be queried. section 11.1.2
Using a high percentile for retries
For speculative retries, use an even higher percentile as a starting point: a 99.9-percentile latency suggests retrying only the slowest 0.1% of requests. Choose the interval from observed query performance so ordinary slow requests do not create unnecessary retry work. section 10.5.3
Figure 11.2 Scylla tracks metrics that change over time, which Prometheus ingests at a specified frequency.
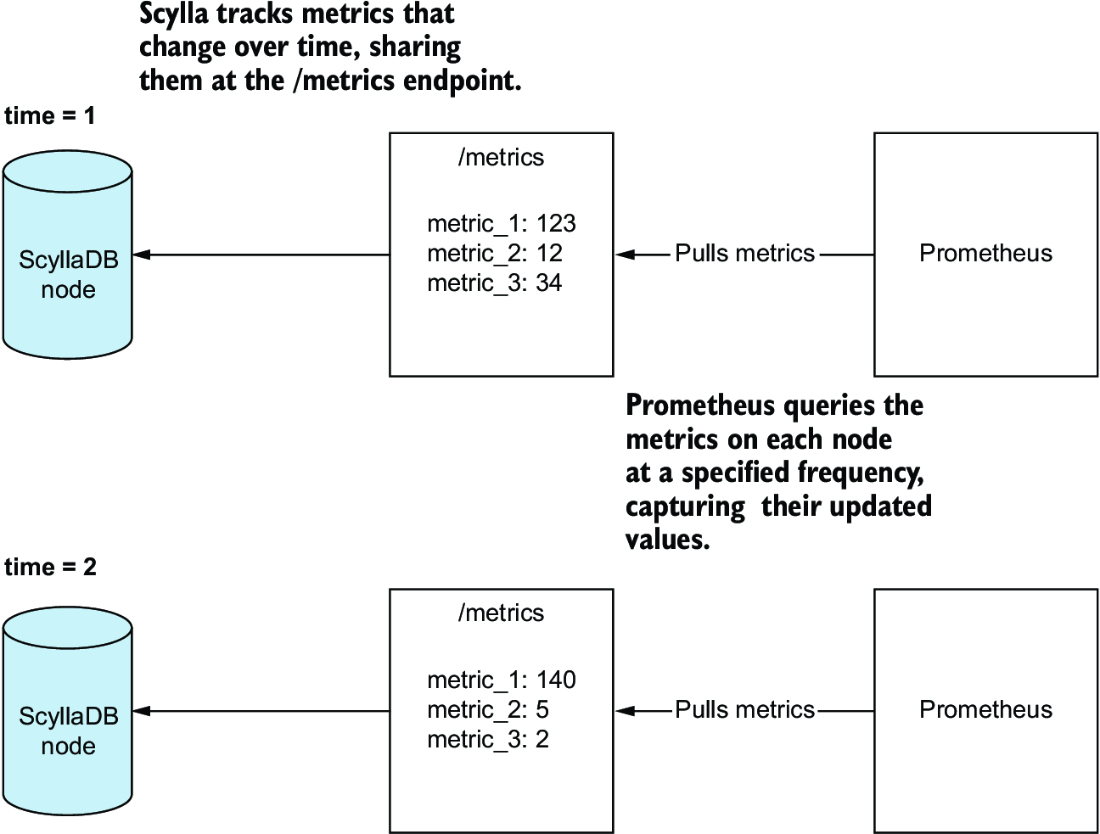
This timeline view helps relate percentile latency to metrics collected repeatedly from Scylla nodes. section 11.1.2
Monitoring rules can package complex calculations, including 95th-percentile read latency, for dashboards and alerts. Grafana can then display prepared views of cluster performance, while Prometheus evaluates alert thresholds from the collected metrics. section 11.4






