A Pareto frontier represents the best available trade-offs when several objectives compete. A point is nondominated when no other feasible point improves every objective at once. In a two-objective maximization plot, a point is dominated if another lies both above and to its right; the nondominated points form the boundary beyond which no collected point lies. section 11.2 section 11.5
Figure 11.6 The Pareto frontier that traces through the nondominated points. No data point lies beyond (above and to the right of) this Pareto frontier.
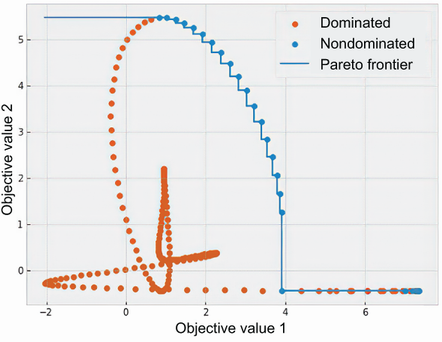
View the frontier in objective-value space: it traces the nondominated points rather than selecting one universal best point. section 11.2
The frontier turns a set of trade-offs into a progress measure. Its dominated hypervolume is the area below and to the left of the frontier in two objectives, or the corresponding volume in higher dimensions. A reference point supplies the lower endpoint of that region. Larger hypervolume indicates a dataset that covers more desirable objective space. section 11.2 section 11.5
Improving a trade-off boundary
For two objective functions with different maximizers, dense search reveals nondominated groups and their frontier. In multiobjective Bayesian optimization, a candidate that is likely to become nondominated can extend that boundary. Expected Hypervolume Improvement (EHVI) scores candidates by their expected increase in dominated hypervolume, balancing regions that may improve different objectives. section 11.2 section 11.3
Use a Pareto frontier to compare multiobjective search results:
- Plot observed points by objective values and retain points that no other point improves across all objectives. section 11.2
- Trace the retained points as the frontier, then measure the dominated region from a chosen reference point. section 11.2
- Prefer search policies that increase hypervolume efficiently; EHVI is compared with alternating single-objective EI through this metric. section 11.3


