A perceptron is a simple classifier for yes/no decisions. It looks at input features, gives each one a weight, adds those weighted values and a bias, and turns the result into a prediction. Think of it as drawing a boundary: points on one side are labeled yes, and points on the other side are labeled no. section 5.27 section 5.7
A tiny sentiment classifier
Suppose sentences use the words aack and beep. A sentence with more aack than beep can be called happy; one with fewer can be called sad. Plotting the two word counts makes each sentence a point, and the boundary #aack − #beep = 0 splits the happy and sad regions. section 5.1 section 5.2
For two features, a perceptron boundary can be written as ax₁ + bx₂ + c = 0. The numbers a and b are weights, and c is the bias. For a new point, calculate the same weighted sum: a nonnegative score belongs to the positive zone, while a negative score belongs to the negative zone. With more features, the line becomes a plane or higher-dimensional hyperplane. section 5.7 section 5.9
Figure 5.21 Each point tells the classifier what to do to make life better for itself. The points that are correctly classified tell the line to stay still. The points that are misclassified tell the line to move slightly toward them.
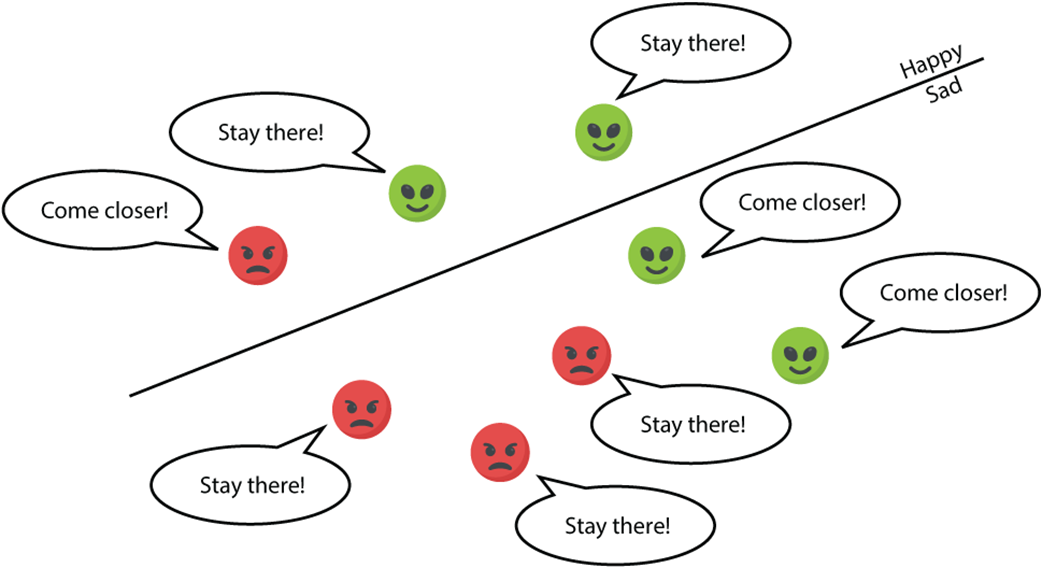
Use the diagram to see the central training idea: a correctly classified point leaves the boundary alone, while a misclassified point pulls it closer. section 5.15
Training starts with random weights and bias. Repeatedly choose data points and apply the perceptron trick: if a point is wrong, move the classifier slightly so that point is a better fit. The learning rate controls the size of each move, and epochs control how many passes the process makes. Training can use one point at a time or mini-batches. section 5.13 section 5.15 section 5.17
A perceptron is useful when the classes can be separated reasonably well by one straight boundary:
- Classify labeled examples into two categories, such as spam or ham, sick or healthy, or whether a viewer may watch a movie. section 5.0 section 5.22
- Model simple logical gates such as AND and OR. section 5.28
- Serve as a building block in neural networks, where outputs from some perceptrons become inputs to others. section 10.25 section 10.6
A single perceptron cannot make every kind of split. If two classes cannot be separated by one line, it can only find a line that separates them as well as possible. The XOR exercise is a useful reminder that some patterns need more than one perceptron. section 5.15 section 5.28
Build and inspect one in Python
Represent each example as a row of features and its category as a label. With scikit-learn, create a Perceptron, call fit(features, labels), then call predict(features). You can also inspect the learned coefficients and intercept; different weights can still classify the same dataset well. section 5.18 section 5.21
Figure 10.7 A visual representation of a perceptron. The inputs (features and bias) appear as nodes on the left, and the weights and bias are on the edges connecting the input nodes to the main node in the middle. The node in the middle takes the linear combination of the weights and the inputs, adds the bias, and applies the activation function, which in this case is the sigmoid function. The output is the prediction given by the formula ŷ = σ(3x1 – 2x2 + 4x3 + 2).
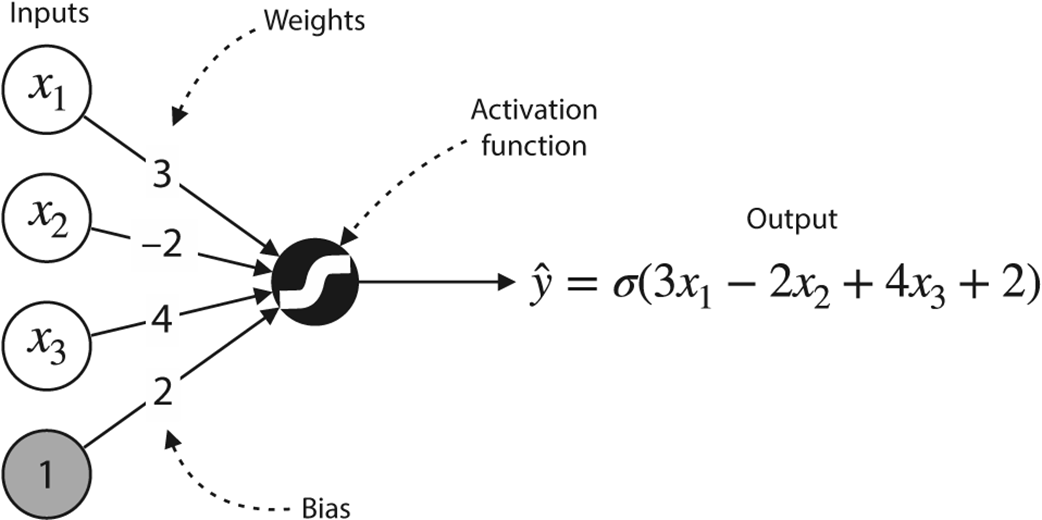
This diagram maps the calculation to a node: inputs travel along weighted connections, the bias is added, an activation function is applied, and the result is output. section 10.5