Sales are the quantities actually sold when customer demand can be met by available supply. They are not the same as demand: demand records what customers want, in what quantity, and when; sales record what can be achieved under inventory and supply constraints. When stock is available, sales can stand in for demand. During shortages, they cannot. section 2.2.1 section 3.0
Using sales as the forecasting target can hide unmet demand. A stockout lowers observed sales even when customers still want the product, so a forecast trained on those sales can predict zero replenishment, perpetuate the stockout, and appear perfectly accurate against zero sales. Forecast demand instead, then use the forecast to support supply and inventory decisions. section 2.2.1 section 14.4.1
Treat historical sales according to availability:
- Use sales as demand evidence when inventory was sufficient to meet incoming demand. section 3.0
- Collect customer orders and retain a backlog when shortages prevent fulfillment, preserving requested product, quantity, and delivery date. section 3.0
- Flag out-of-stock periods and censor their low sales values so a forecasting model does not interpret constrained sales as weak demand. section 3.2
- Consider hidden shortages caused by inaccurate inventory records, unavailable shelf stock, or unacceptable freshness, even when systems show inventory remaining. section 3.2
- Use improved demand data to estimate lost sales and the revenue impact of shortages. section 3.0 section 3.4
Chocolate ice cream stockout
Children may still want chocolate ice cream, but an empty freezer produces no chocolate sales. If tomorrow's reorder is based on a forecast of those zero sales, no chocolate is replenished and future sales remain zero. The forecast and stock-target KPI may both look perfect while unmet demand continues. section 2.2.1
Forecast evaluation should also compare forecasts with demand rather than constrained sales. Accuracy alone can mislead: an accurate but biased forecast may contribute to lost sales, while an inaccurate but unbiased one may create supply-chain variation. Select metrics and KPIs that support useful supply-chain decisions rather than rewarding an artificially low sales baseline. section 8.1 section 14.4.1
Figure 3.1 Sales vs. inventory for a product sold online
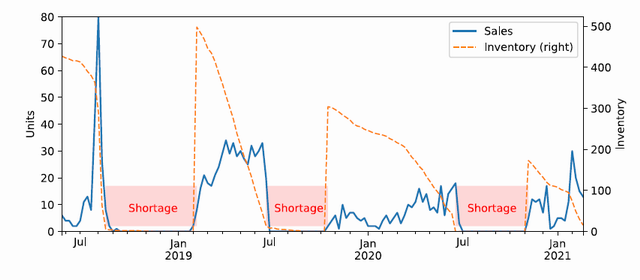
Inspect inventory and sales together to separate periods where sales reveal demand from stockout periods where observed sales are constrained. section 3.2