Qualitative data consists of nonnumerical values that describe types or qualities, such as country names, movie genres, gender identity labels, or clothing sizes. Its values are either nominal, with no inherent order, or ordinal, where the order matters. section 3.1.2 section 14.2
Use the data type to guide visual and implementation choices:
- Treat nominal values as categories without magnitude; city names and movie genres are examples. section 3.1.2
- Treat ordinal values as ordered categories; T-shirt sizes and coffee sizes preserve an ascending sequence. section 3.1.2 section 14.2
- Represent categories with categorical colors, patterns, symbols, connections, or enclosure rather than quantitative position or length by default. section 14.2
- Choose D3 scales with discrete domains for qualitative values; outputs may be discrete categories or continuous visual measurements. section 3.4.1
Planning a custom visualization
Begin by listing every dataset attribute and marking it quantitative or qualitative. For a painting timeline, encode each painting’s subject with categorical color and its medium with a border, while using size for dimensions and position for time. section 14.2
Figure 14.1 We can group data into two main categories: quantitative (numerical information) and qualitative (nonnumerical information). Quantitative data is discrete or continuous, while qualitative data is nominal or ordinal.
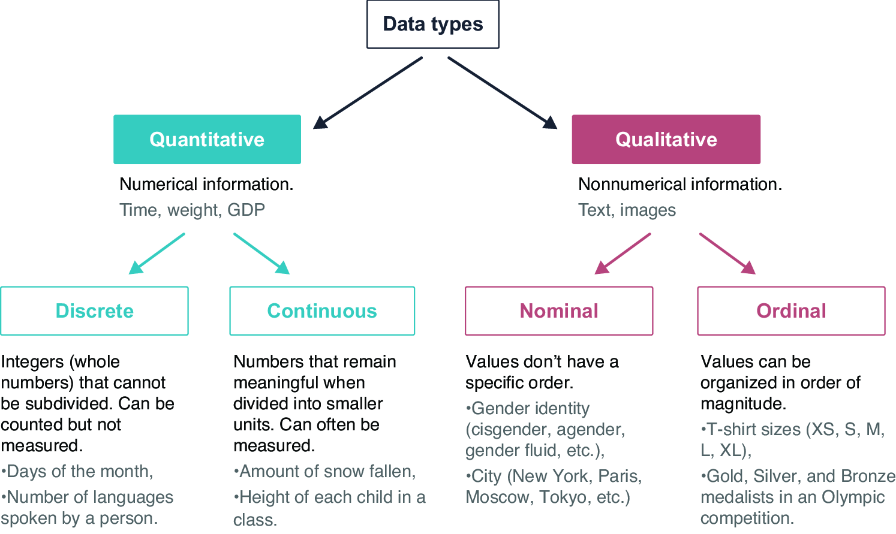
Compare qualitative data with quantitative data, then distinguish nominal from ordinal categories. section 14.2
Figure 14.2 Quantitative data is often visualized with position, length, area, angle, and continuous color scales, while qualitative data uses categorical color scales, patterns, symbols, connections, and enclosure.
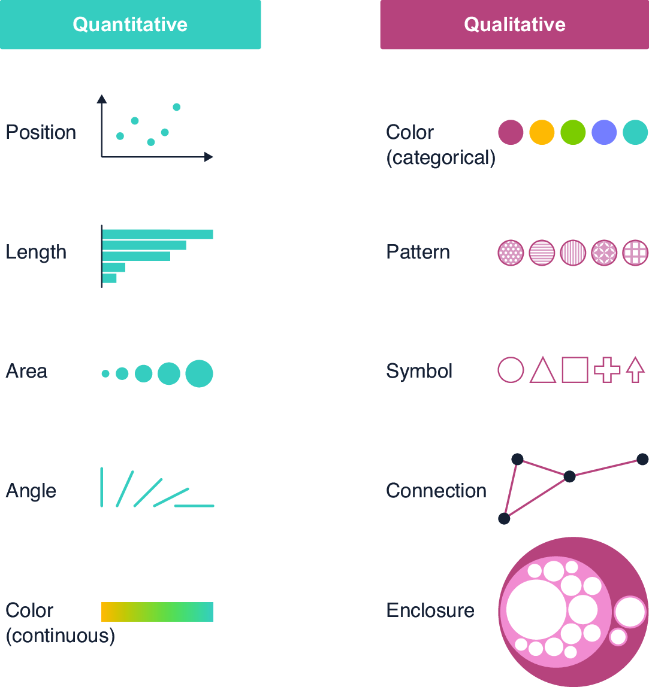
Browse the main visual channels used to encode qualitative and quantitative attributes. section 14.2