Regression discontinuity design (RDD) estimates a causal effect when treatment or exposure changes abruptly at a known time or cutoff. It is useful when an A/B test is impractical: for example, a streaming service cannot release a popular film only to selected customers, but can examine whether views of an older film jump when the new film launches. section 11.0 section 11.2
A simple before-and-after comparison can confuse the event with seasonality or other simultaneous influences. RDD instead focuses on observations close to the event: if competing influences change gradually, they should affect outcomes similarly immediately before and after the cutoff. The remaining discontinuity estimates the event’s causal effect under this local-randomization assumption. section 11.2
Apply the design by:
- Identifying the event date or assignment threshold and measuring the outcome on both sides. section 11.2
- Restricting attention to a small interval around the cutoff, where gradual influences are approximately balanced. section 11.2
- Estimating the jump at the cutoff rather than attributing every before-after difference to the event. section 11.2
- Checking practical approaches such as differences in means or linear regression without ignoring their limitations. section 11.5
A movie-release discontinuity
Suppose daily views of Revenge of the Sith follow a trend but spike when The Force Awakens is released. Compare observations immediately before and after the release, treating slowly changing influences as locally equivalent. Synthetic data with a spike and subsequent decline can test whether the estimation procedure behaves correctly. section 11.0 section 11.2
Figure 11.2 Data simulating the number of views of III. There is a spike in views, followed by a decreasing trend. We can check whether our algorithms are working correctly by testing them on simulated data.
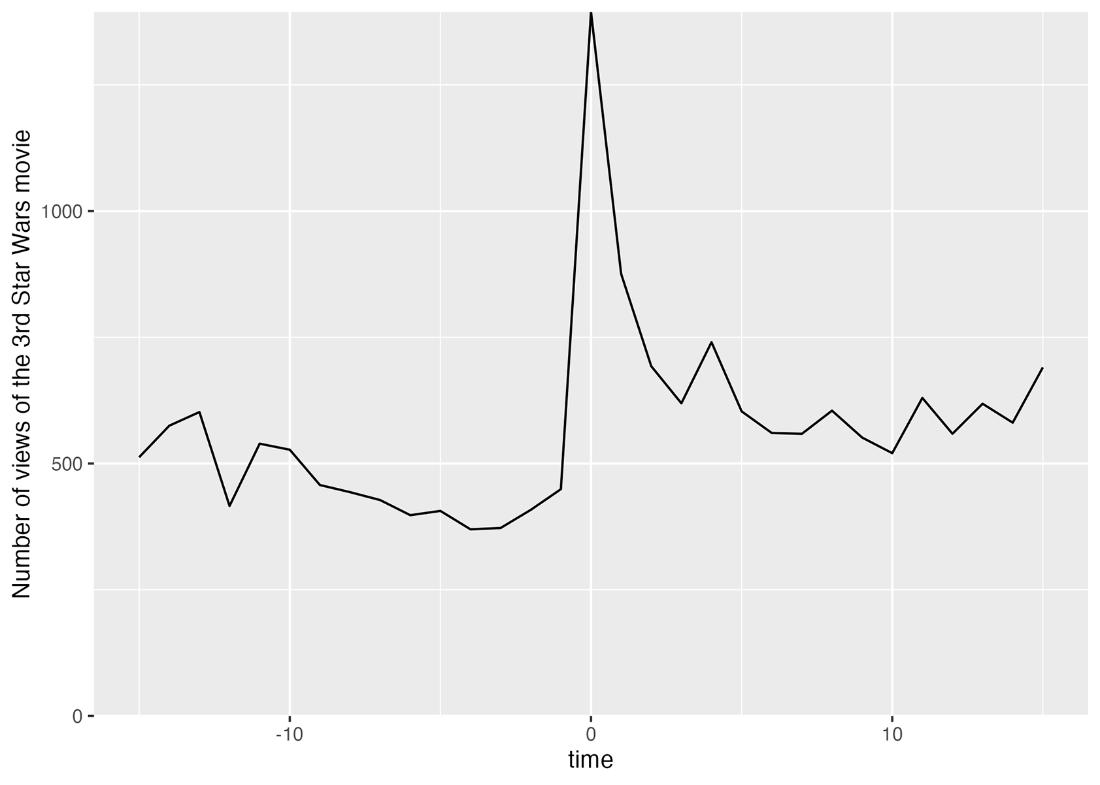
Inspect the simulated time series to see the cutoff-related spike and the following decline before considering an estimated effect. section 11.2
