Utilization is the fraction of an instance’s available capacity actively used over a period. In model serving, it determines how much hourly instance costs are spread across generated tokens. section 10.1
Compare instances at both low demand and saturation. Below an instance’s throughput ceiling, more demand lowers cost per token; at saturation, added demand requires replicas. A faster accelerator can have a larger cost advantage when kept busy, while at low utilization the hourly-price difference matters more. section 10.1
CPU and L4 inference costs
For the compared Llama-2-7B Q4_K_M setup, the CPU instance reaches about 20 tok/s and the L4 about 50 tok/s. At full single-stream utilization, costs are $15.40 and $3.93 per million tokens; below saturation, the cost ratio is 1.57×, matching the hourly-price ratio. section 10.1
Figure 10.1 Effective cost per million Llama-2-7B Q4_K_M tokens versus sustained demand, on Google Cloud c3-standard-22 (CPU-only, solid) and g2-standard-4 with one NVIDIA L4 (dashed) in us-central1 at on-demand list pricing. Each curve declines hyperbolically until the instance's single-stream throughput ceiling (CPU at 20 tok/s, GPU at 50 tok/s; tick marks at successive replica boundaries), then steps up as additional replicas absorb demand above ceiling. Below saturation the ratio between curves equals the ratio of hourly prices (1.57×). At the GPU's saturation the ratio is roughly 3.9×, widening further at higher demand because the CPU instance saturates at 2.5× lower throughput. The L4 wins on cost per token at every demand point in the plot; the gap is bounded between 1.57× and roughly 5×.
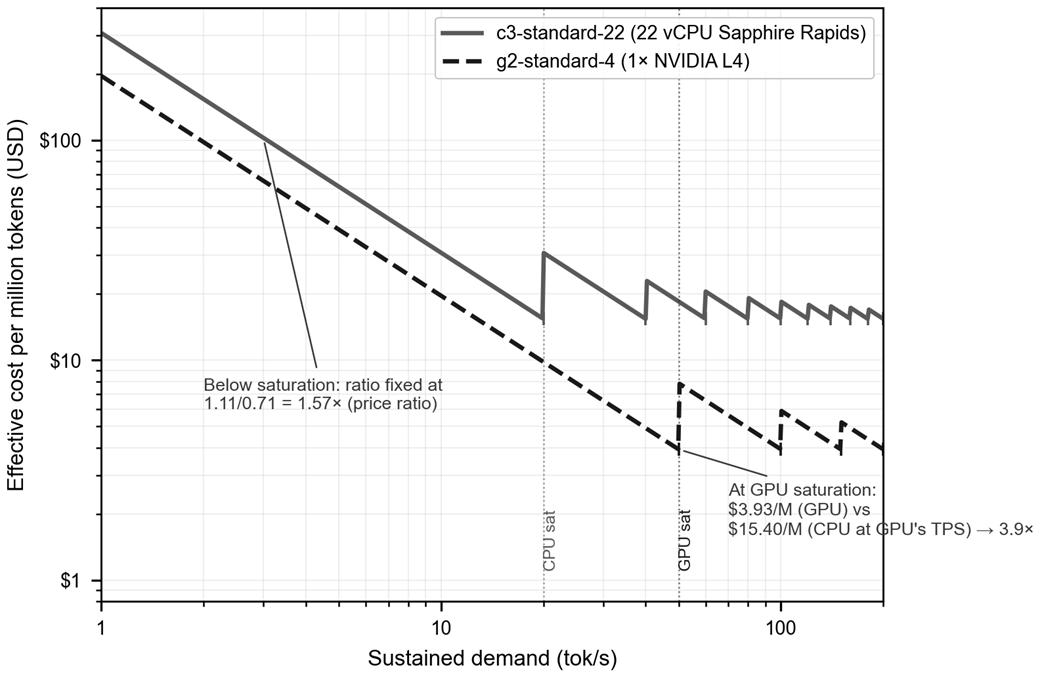
Compare how effective cost per million tokens changes with sustained demand, saturation, and replica boundaries. section 10.1