liveBook · Manning

RGB

As explained in Everyday Data Visualization

RGB color space is a color representation that specifies colors through red, green, and blue components and is commonly used by computer monitors.

RGB represents color with three components—red, green, and blue—using the additive model of light used by computer screens. It is especially common in data visualization. section 4.2.1 section 4.5

A practical RGB color has a few useful properties:

  • Each component commonly ranges from 0 to 255, representing one byte, or eight bits, of information. section 4.2.1
  • Combining green and blue produces cyan in the additive model; different mixtures produce the full range of colors. section 4.2.1
  • The same channel values can be written as hexadecimal triplets, a compact base-16 form. section 4.2.1 section 4.5

Two RGB triplets

(0, 255, 255) produces cyan, while (99, 48, 145) produces a purple. Each position controls the amount of red, green, or blue light. section 4.2.1
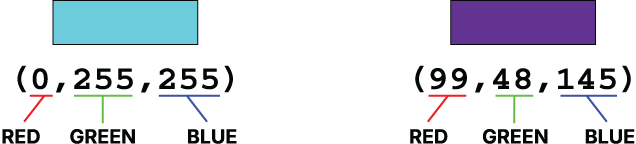
Figure 4.13 Two colors in RGB notation
04-13

Compare two colors written directly as RGB triplets before translating them into hexadecimal notation. section 4.2.1

How Everyday Data Visualization covers it

How deep it goes
Defines triplets, byte-based 0–255 ranges, additive mixing, and hexadecimal notation, but does not develop broader color-selection practice.
Examples
Uses cyan (0,255,255), purple (99,48,145), RGB triplets, and hexadecimal triplets as concrete examples.
What you can do after
Apply RGB triplets or hexadecimal triplets when specifying colors for monitors and data visualizations.
How it connects
Connects additive color, subtractive color, hexadecimal notation, color models, and data visualization.

Also explained in

Compare how 5 books explain RGB →

Related concepts

This explainer was generated by Manning's knowledge graph from the text of Everyday Data Visualization. The section links point to the parts of the book it draws on.