RMSE measures forecast accuracy by taking the square root of the average squared differences between forecast and actual demand. Its squared-error weighting gives large mistakes more influence than small ones, making it useful when major forecast errors create disproportionate supply-chain consequences such as lost sales or dead stock. section 8.5 section 8.5.3
Four-period demand example
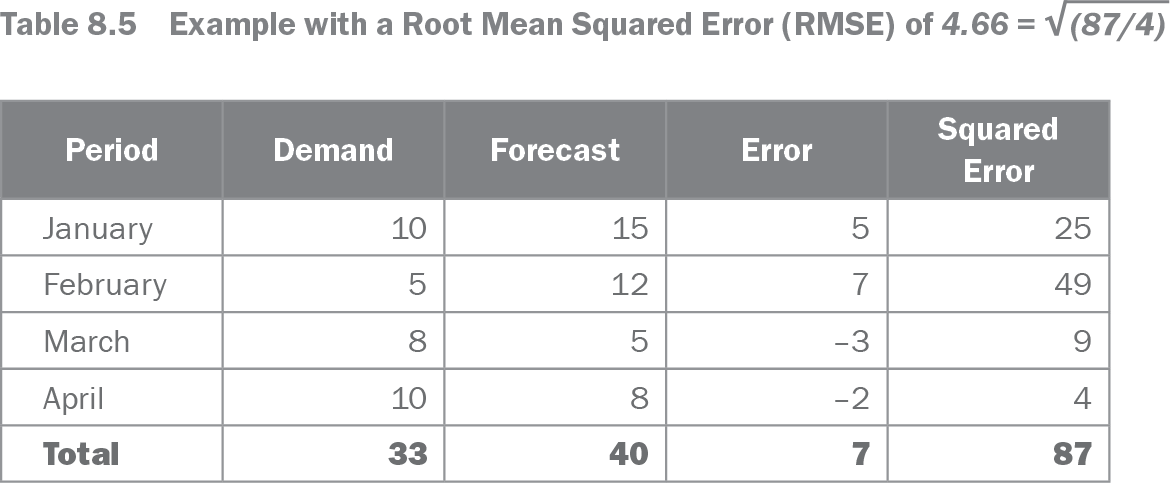
For January through April, the squared errors are 25, 49, 9, and 4, totaling 87. RMSE = √(87/4) = 4.66. The result is an absolute measure in demand units, not a percentage. section 8.5 section 8.5.1
Use RMSE deliberately when comparing forecasts:
- Prefer it when the largest errors deserve extra attention or when evaluating safety-stock-related accuracy. section 8.5.3
- Avoid treating it as universally best: outliers and highly variable demand can make RMSE overreact to a few periods. section 9.1
- Use caution across product portfolios, where squaring errors overemphasizes high-volume items; RMSE is better suited to a single product. section 11.2
- Pair accuracy with bias rather than selecting a forecast from RMSE alone; a combined MAE and absolute-bias score can provide a more robust compromise. section 9.4 section 9.3
Table 8.5 Example with a Root Mean Squared Error (RMSE) of 4.66 = √(87/4) (view table figure)
| Period |
Demand |
Forecast |
Error |
Squared Error |
|---|---|---|---|---|
| January |
10 |
15 |
5 |
25 |
| February |
5 |
12 |
7 |
49 |
| March |
8 |
5 |
–3 |
9 |
| April |
10 |
8 |
–2 |
4 |
| Total |
33 |
40 |
7 |
87 |
Inspect the period-by-period demand, forecast, error, and squared-error table behind the 4.66 calculation. section 8.5
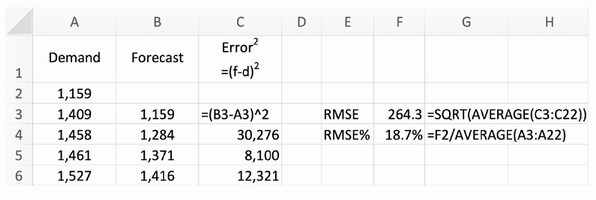
Follow the spreadsheet layout for calculating squared errors and the final RMSE in Excel. section 8.5.2