Skewness measures the degree and direction of asymmetry in a distribution around its center. It adds information about shape that a mean or median alone can miss. section 4.1.1
Use skewness to interpret summary statistics responsibly:
- Compare the mean, median, and other summaries with the distribution’s shape rather than treating one number as sufficient. section 4.1.1
- Recognize that skewed data and outliers can substantially affect the mean, while the median is more robust. section 4.1.1
- Check skewness and related assumptions before applying inferential tests, especially tests that assume normally distributed data. section 4.1.1 section 4.4
Mean and median under skew
Two distributions can have similar medians while differing greatly in shape. In a skewed distribution, the mean and median noticeably diverge; replacing a high outlier with a typical value changes the mean but leaves the median unchanged. section 4.1.1
Figure 4.3 The shape of a distribution can vary widely, and different summary statistics will give you clues about those shapes.
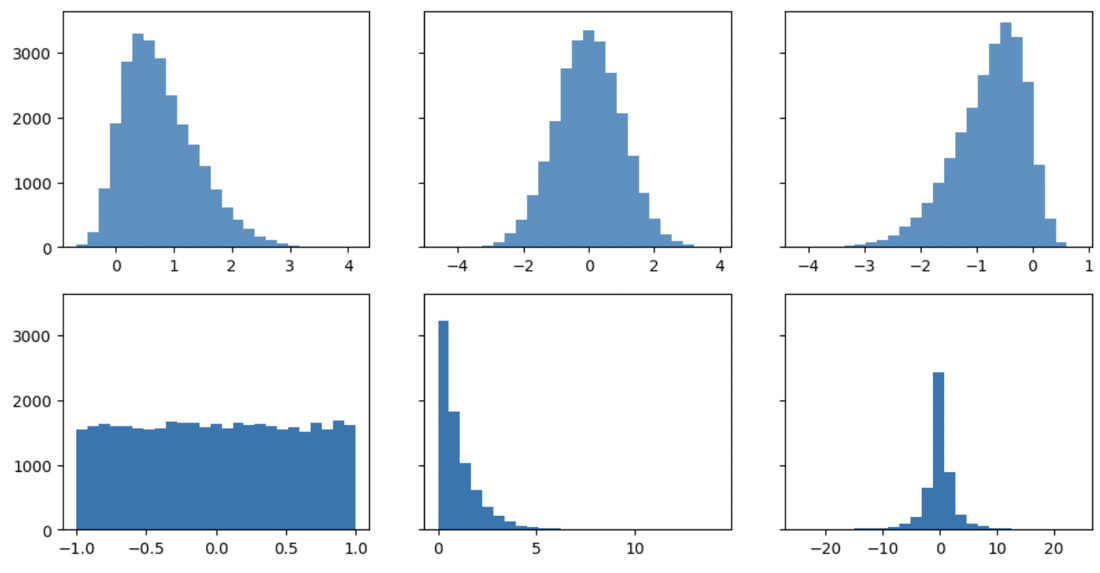
Compare distribution shapes that share similar summary values to see why skewness belongs in data reporting. section 4.1.1




