A set of 20 run times ranges from 0.1 to 1.3 seconds, with a mean of 0.6 seconds. The spread is large: its standard deviation is 0.31 seconds, or 52% of the mean. Repeated measurements need more than a single average to describe them. section 15.3
Figure 15.1. Frequency histogram for our sample, showing the frequency with which each of the measured values was obtained
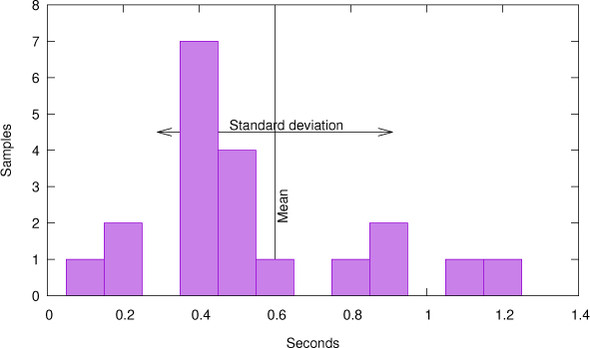
The frequency histogram shows how often each measured run time occurred, making the sample’s shape visible. section 15.3
TAKEAWAY: Skew describes the asymmetry of a distribution. It is an optional statistic alongside the number of measurements, mean, and standard deviation. Standard deviation describes spread; skew addresses whether that spread is lopsided. The sample illustrates why timing results need inspection, but no skew value is given for it. section 15.3
A C statistics collector can accumulate up to the third moment, providing a route to statistics beyond the mean and spread. The displayed timing report prints the mean and relative standard deviation, not skew. section 15.3




