A span records one unit of work within a distributed trace. An incoming request has a trace ID, while each span has its own ID. Spans typically nest into a tree: a REST call can be the root, with method invocations, database calls, or remote requests beneath it. Their timing helps locate slow work or failures along a request’s path. section 10.4
When a request crosses services that support distributed tracing, its trace ID is propagated so their spans can be correlated. HTTP carries this tracing metadata in headers. Without that propagation, a remote service’s work cannot be followed as part of the same trace. section 10.4
Reading a request trace
A request to add a product produces three spans: a root span for the REST call, a SELECT that obtains the next database ID, and an INSERT that saves the product. In Jaeger, a car-availability request produces seven spans across the Users, Reservation, and Inventory services; an individual span can also show request tags such as status code and response length. section 10.4 section 10.4.2
For a Quarkus application, add tracing with `quarkus extension add opentelemetry`, then use Jaeger to inspect collected traces. The supplied Jaeger setup exposes its UI on port 16686 and its OTLP receiver on port 4317. The UI lets you find traces by service and inspect their spans; the number of spans depends on the requests made. section 10.4.2
Figure 10.15 Jaeger UI—graph of spans from calling the car availability endpoint
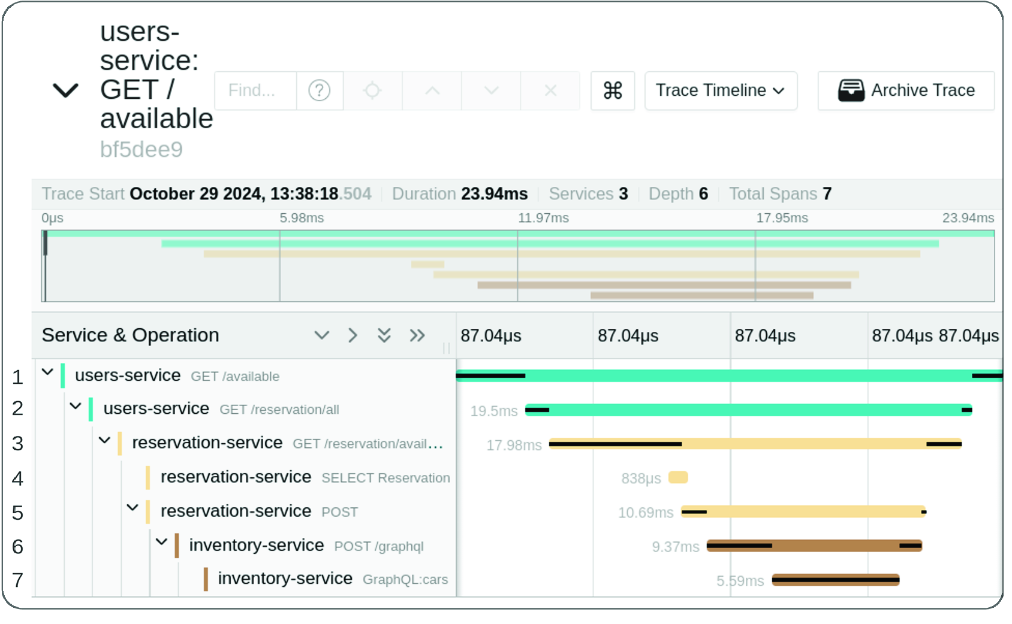
The graph makes the relationships among spans in a car-availability request visible across services. section 10.4.2





