A span is a recorded unit of work representing one step in processing a request or operation. Several spans can share a trace ID, allowing the request’s events to be reconstructed. section 11.3
Spans make API behavior easier to inspect. OpenTelemetry captures request details and exceptions automatically, while custom spans expose work inside the application, such as database operations, transformations, or external-service calls. section 11.3 section 11.4
A useful span record can provide:
- A name, timing information, status, attributes, and identifiers such as trace ID, span ID, and parent ID. section 11.3
- A connection between multiple processing events belonging to the same HTTP request. section 11.3
- Context-specific attributes that make events easier to find and analyze. section 11.4
Tracing a cart operation
A POST /carts handler can create a custom span named cart.create, then attach the authenticated user’s sub claim and the cart payload with set_attribute(). The resulting internal span remains correlated with the request through its trace ID. section 11.4
Figure 11.10 Autoinstrumentation logs capture only events around the edges of our application, such as HTTP request events. To understand what happens inside our application, we must produce custom logs.
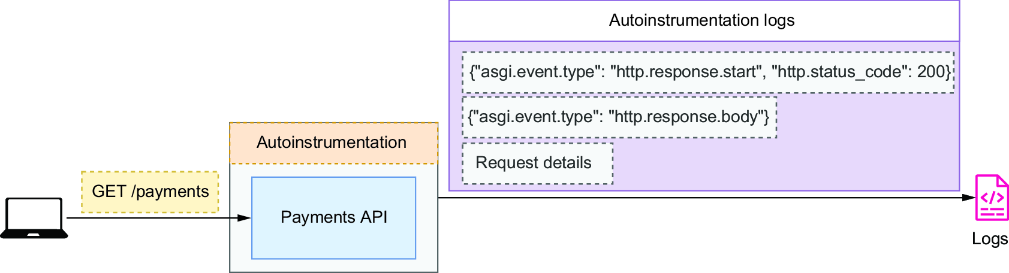
Use the figure to distinguish automatically captured HTTP-edge events from custom spans that reveal work inside the application. section 11.4





