Statistical modeling mathematically represents relationships between predictors and outcomes while accounting for random variation. A model uses an equation to approximate patterns, quantify structure, support inference, and predict outcomes. section 9.1
Use statistical models to:
- Assess the statistical significance of predictors and their relationship with an outcome. section 9.1
- Predict future values within the range represented by the fitting dataset. section 9.1
- Generate insights that support data-informed organizational decisions. section 9.1
- Evaluate performance, fine-tune the fit, and produce deliverables suited to stakeholder needs. section 9.0 section 9.3
Choosing a modeling deliverable
A marketing analyst can model whether people who click advertisements convert into free-trial or paying customers. The useful deliverable depends on whether stakeholders need explanations of influential factors or live conversion predictions. section 9.3
Figure 9.1 A linear regression with two variables (a predictor and outcome) is one of the simplest forms of statistical models to fit to your data.
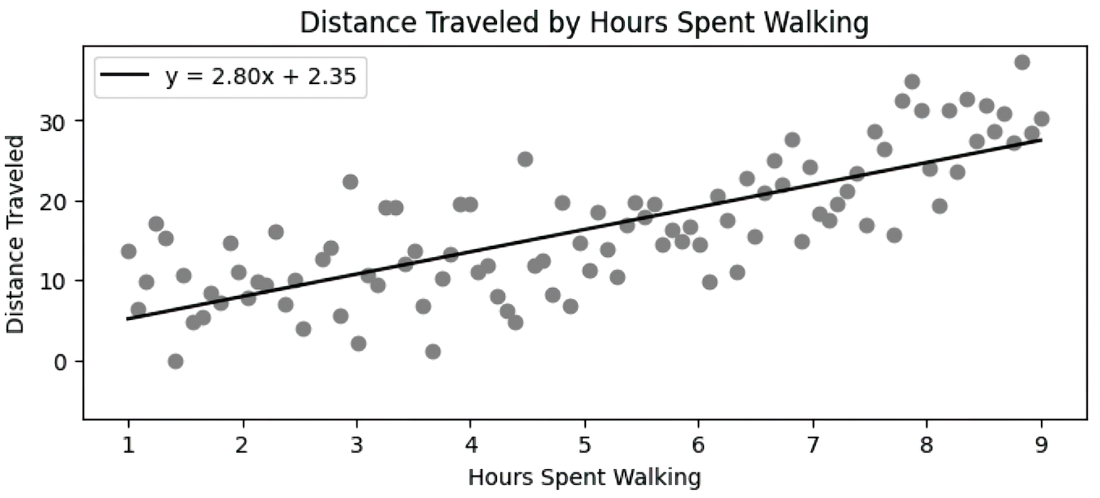
A two-variable linear regression provides a simple visual example of a predictor, an outcome, and an equation fitted to observed data. section 9.1
Models are useful approximations rather than perfect descriptions of reality. A good fit captures the general shape and trend of observed data, but complex processes and unmeasured influences prevent guaranteed accuracy. section 9.1



