Statistical significance means a result meets a chosen criterion for being relatively unlikely under a specified null hypothesis. It helps analysts decide how confidently to report a measured difference or relationship, but it does not, by itself, explain why the result occurred or whether it matters to a stakeholder’s decision. section 4.2.1 section 2.2.2
A responsible interpretation checks more than the test statistic:
- Identify the test and its coefficient. A t-test produces a t-value; coefficients from different tests, such as t-values and ANOVA F-values, are not directly interchangeable. section 4.2.1
- Use the relevant degrees of freedom and chosen p-value threshold to assess the result. A coefficient alone provides limited evidence about significance. section 4.2.1
- Check the test’s assumptions before trusting its conclusion. Parametric tests may require attention to distributions, equal variances, and outliers; when adequate checks are infeasible, consider non-parametric statistics. section 4.2.1
The same comparison with more observations
A comparison of two groups’ test scores is non-significant in the smaller-sample illustration. Increasing the sample size by a factor of ten produces a statistically significant result. Report both the comparison and its sample size rather than treating the significance label as the whole finding. section 4.2.1
Figure 4.26 Increasing the sample size by a factor of 10 yields a statistically significant result.
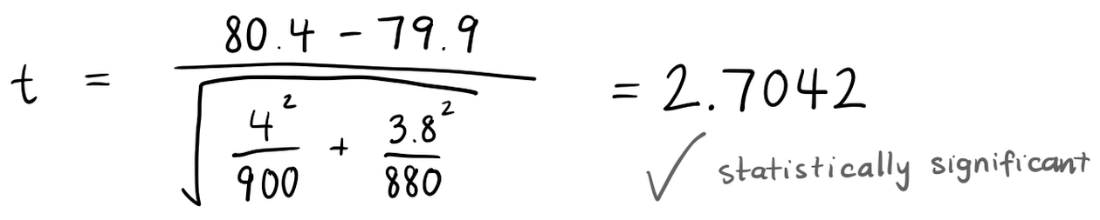
The figure illustrates how increasing sample size can change whether a group comparison reaches statistical significance. section 4.2.1
When findings conflict with a stakeholder’s hypothesis, revisit the behaviors and measures behind that hypothesis. A non-significant result does not establish that no relationship exists or that the opposite relationship holds. If a difference points in the expected direction but is non-significant, describe it as promising rather than confirmed; more time, users, or data may be needed. section 2.2.2






