A total effect answers a change-oriented question: if X changes, how does Y change through every causal route from X to Y? It includes a direct route and any routes carried by mediators. This differs from a direct effect, which holds the rest of the system fixed, and from an association created by a confounder, which is not a causal path. section 6.1.2
Start by stating which effect serves the decision. A topic can affect pageviews directly through reader interest and indirectly through the advertising platform selected. The total effect combines both routes. If the question is about the topic apart from platform influence, the target is the direct effect instead; choosing the wrong target can produce a correct answer to the wrong question. section 3.2.4
Graph illustrating the influence of Topic on Pageviews. This graph can help us understand how the topic affects the number of pageviews a page receives. Additionally, we may also explore how the platform affects pageviews.
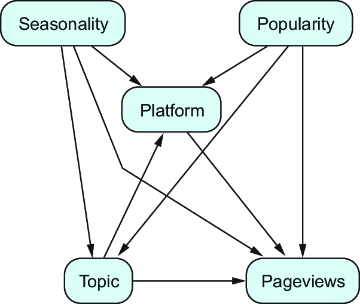
Use the diagram to trace the directed routes from Topic to Pageviews and distinguish the mediator role of Platform from the treatment role it can take in another question. section 6.1.2
For linear models, total effect = direct effect + indirect effect. Causal influence travels only along directed paths from X to Y; a path such as X ← Z → Y signals confounding rather than a causal route from X to Y. The additive decomposition does not generally carry over to nonlinear models, whose fuller treatment requires counterfactuals. section 6.1.2
Hotel distance under an existing pricing policy
Suppose distance affects customer count directly and also changes price, which then affects customers. With the historical pricing policy, the total distance effect is the sum of the direct effect (−10) and indirect effect: (−2) × (−3) = 6, giving −4. Because no confounder lies between distance and customers, a simple regression of customers on distance estimates this total effect; the reported coefficient is about −3.898. A new pricing policy changes the indirect route, so it changes the relevant total effect. section 6.1.1
Figure 6.1 Graph illustrating the data-generation process for creating synthetic data, as described in the example. The arrows in the graph are labeled with their corresponding linear coefficients, all of which are negative, as this fits the context of the data modeled.
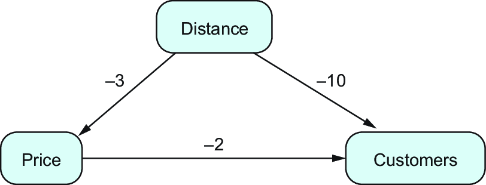
Inspect the synthetic hotel graph to see how distance reaches customers both directly and through price, with coefficients attached to each arrow. section 6.1.1
For a total-effect estimate with linear regression:
- Use the causal graph to identify back-door paths from X to Y. section 7.4.5
- Adjust for a set that closes every back-door path and contains no descendant of X. section 7.4.5
- Do not control for mediators when the goal is the total effect; controlling for them is required for the direct effect instead. section 7.4.5
- Fit Y ~ X + Z, where Z is the valid adjustment set; the coefficient of X is an unbiased total-effect estimator under the stated linear-model conditions. section 7.4.5
The same variable can play different roles as the causal question changes. Platform is a mediator when estimating Topic → Pageviews, but becomes the treatment when estimating Platform → Pageviews. Total effects therefore belong to a specified intervention, outcome, graph, and adjustment strategy—not to a variable in isolation. section 3.2.4 section 6.1.2
