Architecture decisions need a view of what the business is trying to achieve, not just which technology is available. Wardley Mapping creates that view collaboratively: a map connects user needs to the components that support them, showing how visible those components are to users and how far they have evolved. Business and technology specialists can use it to discuss where change may create advantage and where modernization effort may have little payoff. section 5.0 section 1.2.2
To make a first map, work through six questions:
- What is the purpose, and how broad should the map be? Scope can range from an entire business to one product or capability. section 5.2
- Who are the users, and what does each need? Include relevant customers, employees, or partners. section 5.2
- Which components support those needs? Connect them into value chains, then place each component on the map at its estimated stage of evolution. section 5.6
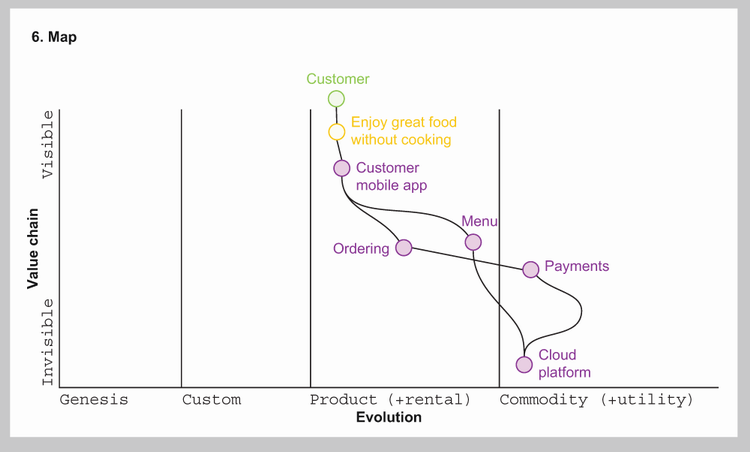
The completed canvas step shows how value chains become a Wardley Map once components are positioned by evolution. section 5.2
Map a food-delivery marketplace
Start with two purposes: connecting hungry people with local takeaway food and enabling restaurants to offer an efficient takeaway service. At a broad scope, identify customers, restaurants, and riders as users. Their differing needs provide starting points for value chains; the resulting map gives the group something concrete to question and refine. section 5.2
Read positions as strategic hypotheses, not a fixed forecast. Components may move from genesis through custom built and product to commodity, or cease to matter. Genesis is uncertain territory where future advantage may emerge; commodity favors stability and efficiency over differentiation. Ask how much demand exists for a component to evolve, and how quickly its landscape might change. Miro’s rapid growth during the pandemic illustrates why past pace alone is not a safe prediction. section 5.4.1 section 5.4.4 section 5.6
Use the map to look for missing future differentiators, excessive investment in commodity components, and candidates for strategic IT. A position on the evolution axis is only a starting point: examine how each candidate actually contributes to differentiation before funding it. Revisit the map as understanding changes; EventStorming can deepen domain insight, while Core Domain Charts can help compare investment choices. At Vinted, repeated sessions using both mapping techniques helped align technical investment with a longer-term product vision. section 5.6 section 10.1.2 section 10.4