liveBook · Manning

Binomial distribution

As explained in Starting Data Analytics with Generative AI and Python

A binomial distribution gives the probabilities of the number of successes in a fixed number of independent Bernoulli trials with a common success probability.

A binomial distribution models the number of successes across a fixed number of independent trials, where every trial has the same success probability. It applies to binary outcomes such as success/failure, yes/no, or 1/0. section 2.6.1

Ten trials

With n=10 trials, the distribution shows the probability of 0, 1, 2, and up to 10 successes. More than two bars therefore represent aggregate results across multiple binary trials, not more than two outcomes from one trial. section 2.6.1

Practical applications include:

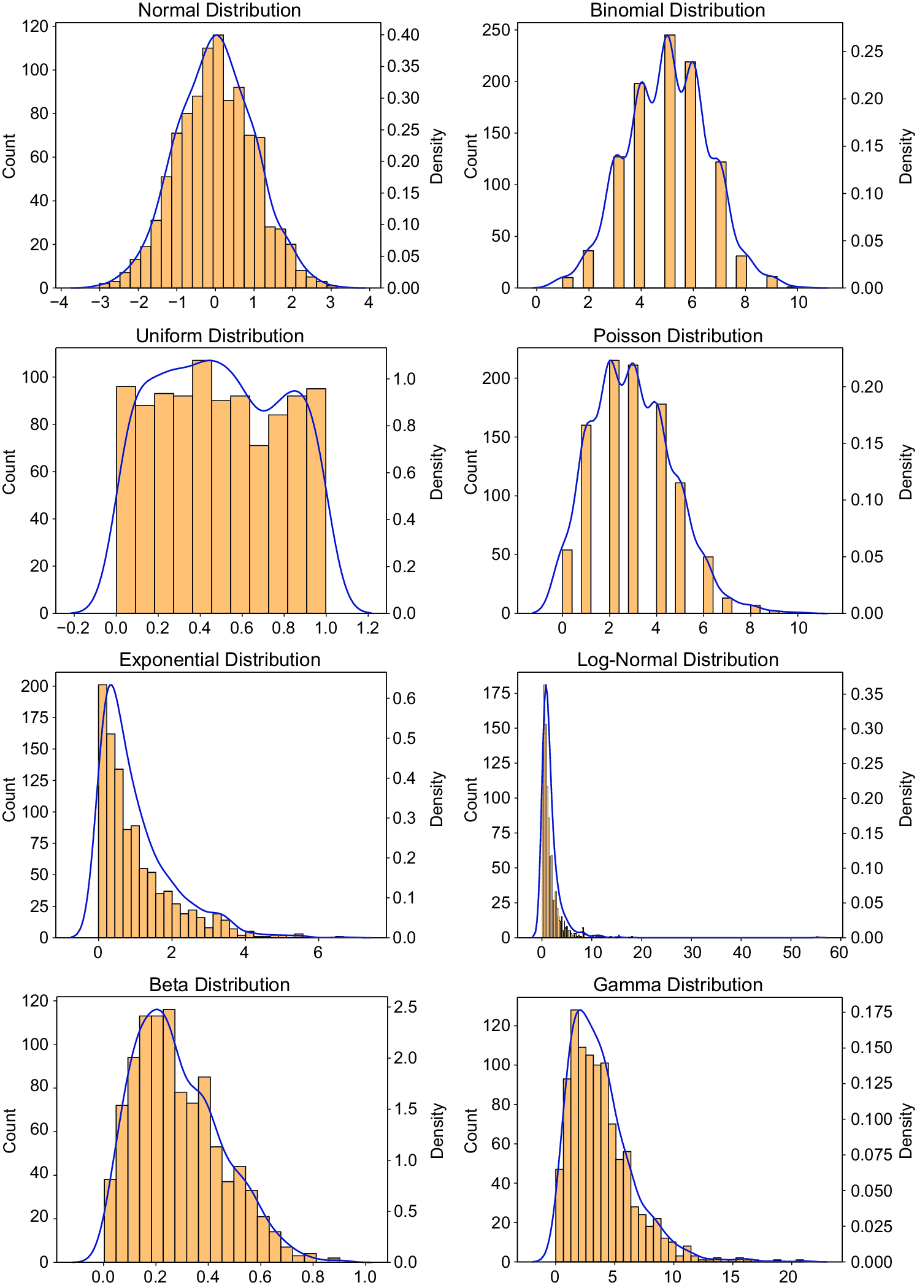
Figure 2.2 Commonly encountered data distributions
figure

Compare the binomial distribution with other commonly encountered data distributions. section 2.6.1


How Starting Data Analytics with Generative AI and Python covers it

How deep it goes
Defines the distribution and clarifies its n+1 aggregate outcomes through a ten-trial example.
Examples
Uses coin flipping, A/B-test conversions, quality-control pass rates, advertising clicks, and ten-trial success counts.
What you can do after
Evaluate/understand whether binary-trial data represent individual outcomes or counts of successes across multiple trials.
How it connects
Connects binary outcomes with Bernoulli trials and contrasts the model with the normal distribution.

Also explained in

Compare how 6 books explain binomial distribution →

Related concepts

This explainer was generated by Manning's knowledge graph from the text of Starting Data Analytics with Generative AI and Python. The section links point to the parts of the book it draws on.



