A bucket, or bin, is an interval used to group numeric observations within a histogram. Its frequency represents how much data falls in that range. section 11.2.2
Buckets support two related tasks:
- Represent each feature’s distribution so unusually sparse regions can contribute to a univariate outlier score. section 6.2
- Approximate an empirical feature distribution for synthetic-data generation by sampling bin centers and adding jitter. section 11.2.2
- Trade detail against stability: too few buckets can hide structure, while more buckets may be needed for some datasets. section 11.2.2
Sampling from buckets
For each numeric baseball feature, compute a histogram, average adjacent edges to obtain bucket centers, normalize bin frequencies into probabilities, sample centers, and add random jitter. This preserves individual feature distributions but, when features are generated independently, does not preserve their associations. section 11.2.2
Figure 6.5 Example histograms for a dataset with three features
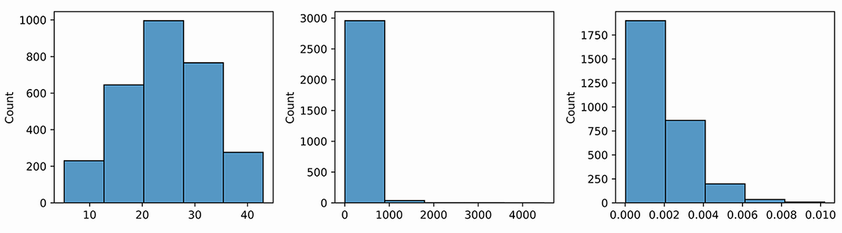
Compare example histograms to see how bucket boundaries summarize distributions across multiple features. section 6.2