Capacity planning determines whether an AI-powered feature can serve expected and peak workloads reliably, quickly, and cost-effectively. It connects infrastructure decisions to latency, traffic volume, operating cost, and product experience. section 4.0
A practical capacity plan evaluates:
- CPU, memory, and GPU requirements at different traffic levels, using load testing to measure how resource needs scale. section 4.5.1
- Cost-performance trade-offs, such as whether lower latency from a larger instance justifies its additional expense. section 4.5.1
- Vertical scaling versus horizontal scaling, based on whether the model benefits more from larger machines or distributed smaller instances. section 4.5.1
- Bottlenecks beyond traffic volume, including slow inference, feature retrieval, poor batching, cold starts, memory leaks, GPU saturation, and dependency limits. section 4.5.1
Autoscaling tools such as Kubernetes autoscaling, AWS Auto Scaling, and GCP managed instance groups can adjust resources to traffic patterns, but they do not replace performance evaluation. Continue measuring bottlenecks at the model, service, dependency, and product-experience layers. section 4.5.1
Shadow traffic
Shadow testing duplicates production requests, so the evaluated system may impose at least twice the computational load. Capacity planning must account for this overhead without degrading production. Stateful systems also require isolated data stores or safeguards against duplicate writes, while agent systems may need dry-run adapters, sandboxed APIs, read-only credentials, recorded responses, or mock tool outputs. section 4.3.3
Figure 4.2 illustrates how shadow traffic adds additional load to the supporting infrastructure such as feature database layer, metadata services, caches and user context lookups. This is one of the primary risks of shadow traffic that's worth over communicating so that the machine learning or platform infrastructure teams aren’t surprised by an increase in requests as a result of the shadow traffic evaluation.
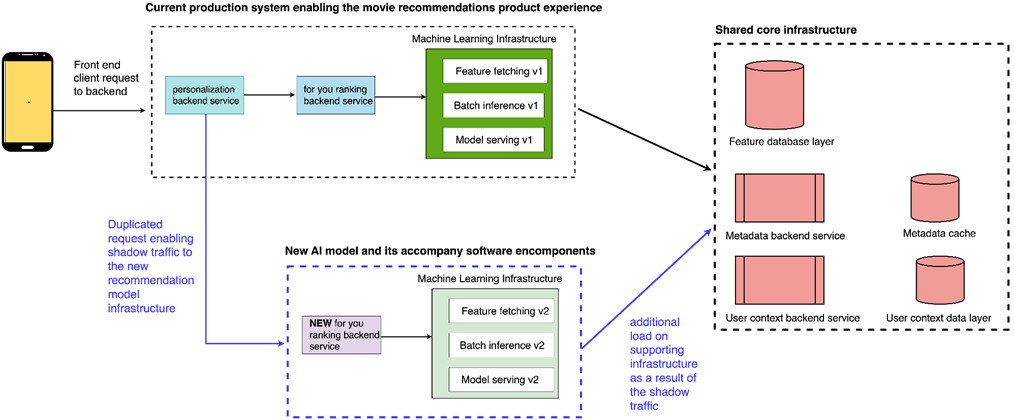
The figure traces how shadow traffic increases load across feature databases, metadata services, caches, and user-context lookups. section 4.3.3